January 31, 2007
Going Global
 I remember seeing a display of population growth at the Monterey Bay Aquarium some years ago. It showed population by adding million person dots to a map as a time counter passed. Intended to have an environmental message it probably sent a chill up the spine of many visitors as they saw the explosion of humans. To me it sent another signal: the sheer beauty and wonder of how our species has managed to colonize this planet thanks to our (admittedly limited) intelligence. Each dot was a million more minds, able to achieve anything.
 The G-Econ project has done some great work on geophysically based data set on economic activity for the world. Their globe visualisation of economic activity filled me with similar awe as the Monterey display, and I immediately decided to try to render my own using their data.
My approach was to read the data into Matlab and use it to produce an include file for the PovRay ray tracer. This way I could both change scaling and color scale, as well as get shadow effects and transparent seas.
Another fun use of the data is to try to figure out the nicest place to live. I like temperate climates, low levels of precipitation, closeness to the sea and a strong local economy. So I made up a quality measure based on the sum of these factors and plotted it. The result was the suggestion that I should move to Tokyo. Other plausible places were California, Chile, south Australia, Osaka and Paris. Namibia might be a less reasonable suggestion.
I love global statistics.
January 24, 2007
Turning the Horde Inside Out
 Horde of Directors is a game by Ian Bogost & T. Michael Keesey is based on THEY RULE . The player tries to convince a corporate board about some activist agenda (apparently some general anticapitalist babble) by buttonholing directors at a party. Each time a director is convinced you also have to convince the other directors at the boards they share. Apparently directors are rather unassertive people who need comfirmation from each other.
It is a well done game and a great way of using the data, although gameplay becomes pretty boring after a while. That is, I believe, the point: the game is futile since more and more directors are introduced all the time. I guess the moral is that changing the minds of directors is pointless because they all form a huge self-reinforcing matrix.
But this seems to be entirely the wrong conclusion. Assuming that the network really is a social influence network (as I argued before, this might not be entirely true), then it would be a good thing to influence a director sitting on several boards.
Maybe the problem with the game is the activist standpoint it is based in. Activism is it is commonly used is about protest, and this is both what the game and the context around THEY RULE do. But in its true sense activism is about changing minds. The babble used in the game is simply generic rather than a specific issue, and hence there is no reason for any director to change their mind. But imagine spreading an idea that would appeal to the directors ("what if we launched fair trade software?! We would earn $$$ and do something good!") instead. They would become allies rather than problems.
Perhaps it is possible to turn the game inside out. Instead of randomly trying to accost all directors of a particular board, the challenge becomes to find the directors that hold the strategic positions in the network to get a maximal amount of change done in the core area. To make it more exciting there could be other players or computer players lobbying for other things turning them back. I actually think a lobbying game would be more interesting than just a demonstration of futility.
Medical Milestones
This week on CNE I talked about BMJs supplement about the 15 major medical milestones since 1840.
One of the most interesting things is that several of them would have been regarded as quite immoral in 1840 (anesthesia was regarded as cheating the divine punishment of pain and as possibly erotic, and contraceptives would have been beyond the pale), or outside the proper field of medicine.
It is interesting to see that at least the Computers: transcending our limits? essay suggests the emergence of a posthuman noosphere could be desirable. That is both something outside of medicine today and something many would feel uneasy about. But if it happens it would clearly have tremendous health effects (a wired society can detect epidemics much faster, and presumably a smart noosphere will be pretty good at advancing medicine).
The list in 2172 might look utterly non-medical to us. It might include nanotechnology both as the foundation of nanomedicine but also as a health-promotor by producing a very malleable environment. Enhancing drugs might have been superceeded by add-on enhancements and eventually an enhanced smart environment - the body is connected to the smarts rather than having them inside. Uploading may be one of the items, spelling the end of biological demands. But I'm pretty sure there will be even more conceptual items on the list. A better theory/ideology of mental health, for example. And I would not be surprised to find entries involving economics and statistics.
They Rule...?
 THEY RULE is one of the best information visualisation apps around. It is interactive, has an easy interface, looks good and enables sharing of findings. It also has a strong message, and that may be its problem: it promotes the image of a vast ruling class conspiracy where everybody networks with everybody in the name of profit and power. The problem with this is that the data used does not support it; it is an assumption added by the context.
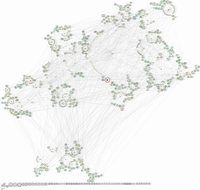
I took the liberty to plot the database as a graph, with nodes corresponding to board members, companies and institutions.
The network is essentially a social network with some pecularities. Boards have a distribution centered around 11 members, while individuals appear to follow a power law (but since the maximum number of boards anybody participates in is 8, this is pretty uncertain).
It clearly has small world properties, and this is what makes THEY RULE so convincing: choose any two corporations and there will be a very short chain between them. But this is not because they are a strongly cohesive group. It is just the effect of a few bridge-builders.
Looking at betweenness centrality picks out the most important connectors (in order of centrality): the Brookings Institution, the Council of Foreign Relations, the University of Pennsylvania, Dr. Judith Rodin and Washington University in St. Louis. After these most central we get a second rank consisting of 3M, the Clinton administration, Shirley Ann Jackson and Kenneth Duberstein. In the third rank we get Proctor & Gamble, MIT, Caltech, Sara Lee, Amgen and Warren Rudman. It is interesting to note the dominance of non-corporate institutions as well as the number of women. If we were to leave out the non-corporate institutions the main cluster becomes less cohesive (it still holds together, though; 3M, Sara Lee and Procter & Gable are now most central).
I think that if we took a similar number of social clubs (the bowling gang, the pub regulars, roleplaying groups etc) and did a similar plot we would find it to be largely similar to this. The only difference is that nobody would seriously view it as a conspiracy. This network depicts people and organisations that do have significant influence, but it does not show the real influence. This is the formal social network of shared membership but it does not show the actual network of information flows, shared (and opposite) goals and informal social interactions. There are plenty of golf clubs, fraternal orders and mutual friends that are more important for that, but they are of course far harder to find. If there is a significant information flow in the overt network it would seem to promote university and think tank boards as key places. But any real plotting will not occur where there are secretaries and transcribers. I think there is a risk that we may stare ourselves blind at formal networks when everybody on this graph is merely a phonecall away from everybody else.
Still, it is nice to see the connections. It might be more enlightening looking at more overtly ideological groups like think tanks, political committees, NGOs etc. Imagine doing this with say http://activistcash.com/ and http://www.sourcewatch.org (ideally both). Hopefully that would dispell the claim that "X is a front for Y" somehow invalidates X's opinions - because if it did, practically nobody would have valid, "pure" opinions. We are all bought and influenced by each other.
January 22, 2007
Teasing out the Social Web
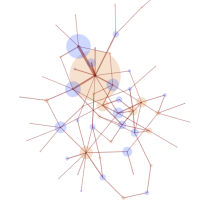 As an exercise in Processing I wrote a small app to visualize the interactions on a mailing list.
The applet reads a locally stored copies of list traffic, connecting people with the threads they post to. In order to avoid cluttering only repeated interactions are shown. The network is run as an interactive force-layout where the user can pull nodes, anchor them and zoom around.
I have found that networks are usually very hard to understand when just viewed passively. That is why I wanted to make this interactive. Anchoring is a very practical method of stretching out the social network to see who is most closely tied to whom or what discussion.
I used local copies of the traffic in order to avoid the hassle of signing the applet. A future version ought to read directly from the list archives. Right now it only covers April 2006 to middle January 2007, but there is plenty of variation from month to month already in this small set. January is dominated by a huge discussion, August has very low traffic and the 2006 spring networks look denser than the autumn ones.
January 21, 2007
Competing Threads?
Recently Damien Broderick suggested that there might be an upper limit to the number of simultaneous threads on a mailing list. I got curious and tried to test this for the Omega mailing list, where I have several years of saved traffic.
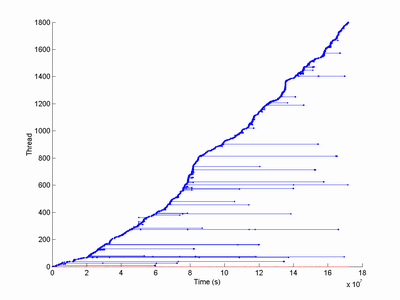
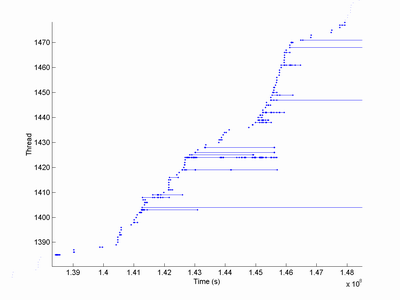
Plotting the extent of threads across time shows an overall pattern of mostly very short threads with a few much longer ones. Some of the longest are likely spurious, due to two different discussions getting the same heading. Zooming in shows a self-similar pattern of threads of widely varying length, periods of rapid posting (producing a nearly vertical ascent of the main curve) and slowdowns.
The overall length distribution of threads is lognormal, with a small cluster of extra long threads perhaps due to unfiltered spurious threads or recurring themes.
Looking at the number of different threads that are active on the same day (ignoring threads longer than one year, as these are definitely spurious) shows an irregular, bursty behavior:
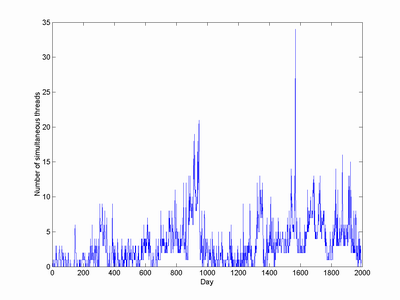
There doesn't seem to be a fixed baseline, rather periods where the baseline is zero, a small number of threads or a burst of many simultaneous threads. It almost looks like a bounded random walk plus some high frequency noise. The distribution looks like a power law for large number of threads but more like an exponential curve for lower levels of activity. The autocorrelation looks nicely exponential with a time constant of about a month, while the actual posting intensity becomes uncorrelated within a few days.
Plotting the length of threads as a function of the average number of other threads during the run produces the following pattern:
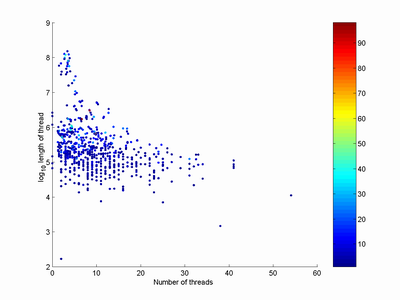
Color represents the number of postings in each thread. At first this seems to support Damien's idea: the most long-lived threads occured near the average levels of activity. Unfortunately these threads of course average over a long period of list activity, so they have to be close to average! Using the maximum number of simultaneous threads during the history of the thread produces a rising curve - the opposite of what we should expect if there is thread competition.
Plotting the number of threads each day versus the number of postings produces this diagram:
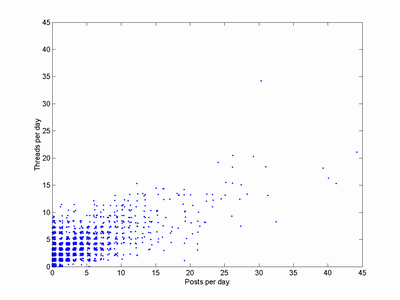
(I have jittered the positions of the points to make the density more obvious, otherwise they would just have formed a grid in the core area). It looks like a rather linear relation: more threads, more posts and roughly the same number of posts per each new thread (or vice versa). If threads competed there ought to be a curve in the point cloud, but there doesn't seem to be any. Possibly high-traffic threads produce a large number of offshoot threads that really should be regarded as part of the main thread and hide the competition effect.
So my guess is that Damien was wrong at least about the Omega list. This is a relatively low traffic list, so maybe the more high traffic Extropians list would exhibit some interactions between the number of threads. But that is a later project.
The New Transhumanist Buzzwords
 George Dvorsky blogs about Must-know terms for the 21st Century intellectual. It is a nice list, with several very important concepts that should be in anybody's mental toolbox.
As a long-time transhumanist I also find it interesting as a sign of where transhumanism is moving. Imagine a list similar to George's made in 1996 by the members of a transhumanist mailing list. I think it would have run something like this:
- Alife
- AI
- Autoevolution
- Bionics
- Cryonics
- Connectionism
- Cryptoanarchy
- Immortalism
- Memetics
- Nanotechnology
- Physical eschatology
- Singularity
- Uploading
Some entries are identical or mean the same thing. AI corresponds to AGI, bionics to neural interfaces, immortalism to SENS, nanotechnology to the assembler, eschatology and the singularity to themselves uploading to mind transfer. Memetics has become mainstream. Alife and cryptoanarchism are somewhat dead as movements (but left an active legacy).
The real difference is what is not on this 90's list. George's list is primarily conceptual: most entries are important ideas like the Anthropic Principle, Neurodiversity or the Simulation Argument. The 90's list was mostly about technologies. The ideas were certainly around then and motivated the enthusiasm for the tech, but it was seen as cruicial to convince people about all the cool tech for them to realize the relevance of the ideas. Today it is the reverse. I think this is also the right way around.
My old transhumanist terminology page is feeling quite old these days but represents 90's transhumanism quite nicely (just like my old website). It is interesting to see that relatively few of George's concepts are entirely alien to the list. There are a few newcomers. Bayesian rationality looks like the epistemic successor of the pancritical rationalism and evolutionary epistemology debated in the old days on the extropian list. SENS is the new and shiny plan for life extension. Existential risks have crept up on the agenda, as has the simulation argument and transparency.
A second difference is the number of political issues on the list. In 96 the only political issue was cryptoanarchy (how many remember the clipper chip these days?) On the current list I see about 8 entries that have heavy political overtones. Some because they have become political (like open source and human enhancement), others because they are intrinsically political. Transhumanism is finally getting into the political field. Again, perhaps several years too late but at least it is happening.
I think this points towards transhumanism finally growing up intellectually. A lot of the core ideas and values are the same, but now they are being intellectually extended and analysed. In the old days we discussed the technology because it was the simplest part of the field. Now we are getting to the final frontier: politics in the real world.
January 19, 2007
Identity Medicine
This week on CNE I blog about identity medicine: should muslims be treated differently in UK health-care? The problem isn't that they want some differences in treatment but the one-size fits all healthcare system that will not and can not provide it (and if there is just a fixed cake to divide, every group will want to claim a larger slice at everybody elses expense).
I just noticed that I said more or less exactly what Samizdata already had said. Great minds think alike, or at least libertarian minds think alike.
January 18, 2007
Melting the Clock
 Junk Charts criticizes the Doomsday Clock, both from a graphical perspective and conceptual perspective . Is it impossible to be more than 60 minutes away from disaster?
I'm perhaps even more annoyed by the inclusion of climate change into the calculation. Depicting a countdown to disaster makes sense when the disaster is something discrete. But what if we get tremendous climate change but no nuclear war? Should that be zero minutes, and if as insult to injury a war occurs, should the clock be at five past? What if climate change occurs, but it turns out to be not too bad?
The clock is a kind of symbol for existential risk, with 12 corresponding to a serious threat to human survival. But even with the most pessimistic interpretations of climate change it seems hard to get a result bad enough to threaten human survival. Drown Bangladesh, wreck harvests, freeze northern Europe and throw in a couple of unexpected hurricanes, and at the very most you get appaling death tolls and suffering locally, but in no way does it threaten the human species (se crude estimate below). The only way to seriously do that using climate change would be to argue for a total loss of planetary homeostasis producing a venusian hothouse (or a snowball earth), but given that Earth has survived periods of far higher CO2 concentrations that is pretty unlikely.
 Perhaps a better approach would be to use two hands on the clock, and one clock for each risk. The minute hand would represent probability (per year or decade or something suitable) of the risk occuring, the hour hand would show expected danger in terms of human fatalities (ranging from no to all).
A thermonuclear exchange might have a probability of 1% per year and would kill about a 200 million people directly and indirectly (based on the estimates I came up with for a fictional setting based on The Effects of Nuclear War). So using a linear scale would put the hour hand at just around one a'clock and the minute hand at nearly one minute over. Not impressive. Lets use a logarithmic scale instead: each 5 minutes is one order of magnitude. So the minute hand will now be 10 minutes away, and the hour hand will point at slightly past ten.
 An impact of 2004/MN Apophis in 2036 has a 1/45,000 chance of occuring and could plausibly kill a few millions. That would put the minute hand at 23 minutes to 12, and the hour hand at about nine.
I have not seen any convincing climate change mortality calculations. This one argues for 7-19 million extra child mortalities in sub-saharan africa by 2050 and 12-33 by 2100 (in the mean scenarios), and 12-21 and 22-34 in Asia. This was calculated based on a model of GDP change due to climate change, and then a model forecasting poverty as a function of GDP and finally a model forecasting mortality as a function of poverty. While perhaps the best we can do given present data, I find the treatment highly uncertain. Given that global population curves have surprised people over the last 20 years and how complex economies are, I'm extremely doubtful of GDP predictions 40 years in advance - let alone how they are affected by climate (what will be the climate effects on nanotech businesses? genetically modified crops? hypereconomies?). I'm also pretty convinced that the model doesn't take technological change into account, and even a slight change in the mortality elasticity has enormous effects on the predictions.
 Anyway, let's say that the probabilty of climate change is about 0.5 - here the number might be more representative of how likely we find a particular risk scenario rather than that the climate is going to change. Assuming an excess mortality on the order of 50 million per year (here we should take into account a likely future human population of 8 billion). In that case we get a minute hand 1.5 minutes to 12 and an hour hand pointing at slightly before ten.
This last example probably demonstrates again the weakness of the clock metaphor when dealing with what is essentially a big family of scenarios - different mortalities, different population sizes, different chances of the outcome. Maybe one could make a clock with blurred hands representing the distribution? It is quite possible to put error bars onto the hands. The logarithmic scale also allows risks down to 10-12 to be shown as well as sub-person threats. Maybe this might be a useful complement to the colors I discussed in my warning sign post.
It looks like the logarithmic foreshortening may make the hour hand a bit too sensitive when it is in the area where these major disaster scenarios play out (much more people die in the nuclear war than in the climate disaster). The clock might be useful in that it provides a quick sense of whether a disaster is somewhere in the "global danger zone" of late evening, the national disasters of early evening, the local disasters of the late afternoon and the personal risks of early afternoon.
January 16, 2007
Criminal because of God or Godly because of Crime?
PJ Manney posted PJ's Big Adventure: The Bible Belt Paradox to the extropians list, starting a vigorous debate. Given the prevalence of religious belief in bible belt states, how come there is so much crime? Shouldn't the godly people refrain from crime and reduce it around them? I don't buy her fun theory that it is the ten commandment's fault, so I did a bit of informal research using the General Social Survey.
Does religious fundamentalism correlate with crime? Comparing the variable FUND ("fundamentalist, moderate or liberal in your religion?") and ARREST ("Were you ever picked up, or charged, by the police?")
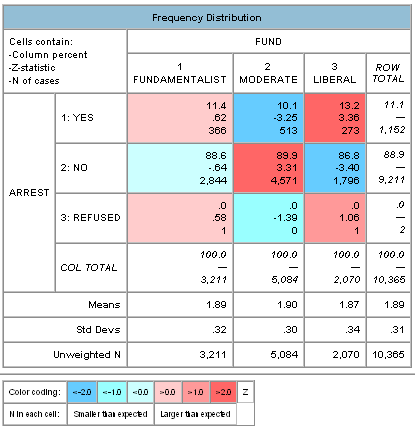
The results shown above demonstrate that there doesn't seem to be a strong linear link. Being moderate appears to increase law-abidingness while liberals seem to be more likely to have been arrested.
See below for a further analysis, leading to the conclusion that people indeed become godly because of crime, not the other way around. Fundamentalism appears to be a defence reaction rather than a cause of crime.
Looking at the TICKET ("Have you ever received a ticket, or been charged by the police for a traffic violation?") shows a stronger pattern: fundamentalists and moderates are less likely than expected at random to get tickets, while liberals get more.
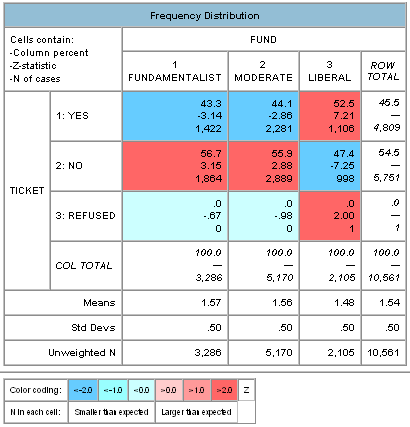
Assuming that the self-reported arrests and tickets are truthful, it doesn't look like fundamentalists are more criminal than others. They are also more likely to think that one should obey the law no matter what, instead of following one's own conscience:
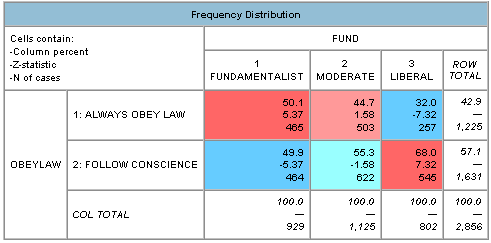
Looking at the CIDEKNEW variable, how many people known to the respondent who were victims of homicide last year a rather chilling pattern emerged. Among fundamentalists far more knew 1-4 victims than would be expected by chance, while moderates and liberals did not have the same pattern.
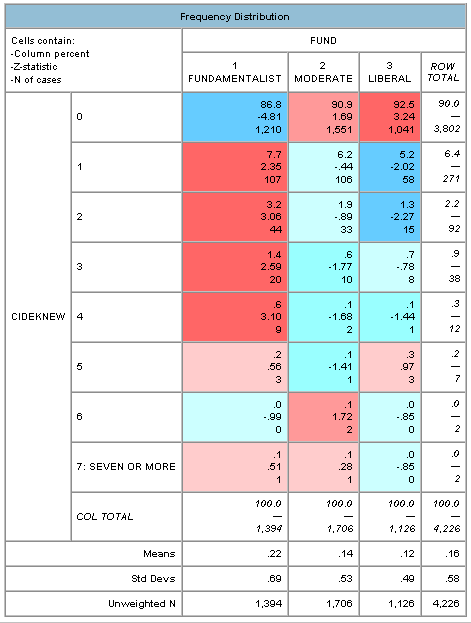
(Incidentally, this seems to suggest that prayer is not very efficacious; presumably fundamentalists pray for the safety of their family and friends more, but they have a higher likeliehood of getting killed. However, this might just be confounded by other factors, see below)
It doesn't seem that likely fundamentalists have selective memories for homicides, so they certainly appear to live in a dangerous environment. This brings up the whole issue of socioeconomic status.
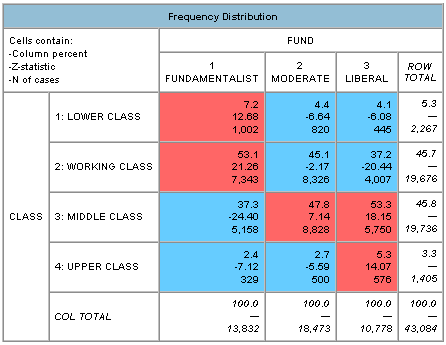
Fundamentalists are overrepresented in lower and working class (self estimated), while religious liberals are overrepresented in middle and upper class (correlation between FUND and CLASS is 0.15).
The same is true for self-stated RANK (correlation -0.12).
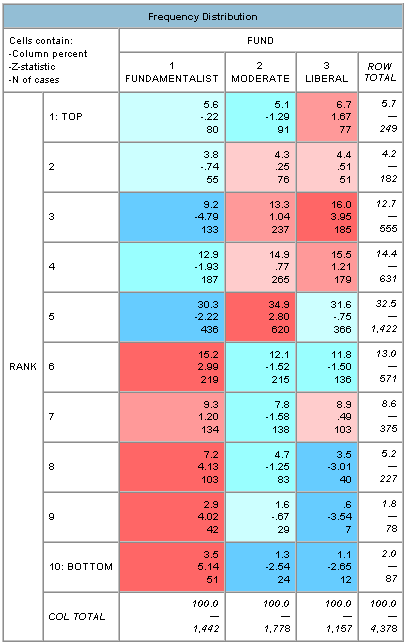
Their income also tends to be lower. So unless fundamentalists are likely to understate their social rank they seem to be worse off in society.
They are also fearful. There seem to be unusually many fundamentalists scoring high on FEAR ("Is there any area right around here where you would be afraid to walk alone at night?"), and fewer feeling safe at home (FEARHOME, "How about at home at night--do you feel safe and secure, or not?").
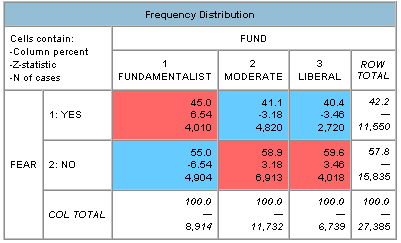
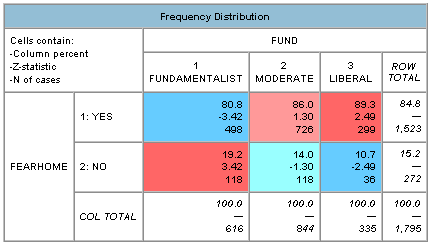
To sum up, fundamentalists do not appear to commit more crimes, but they live in more unsafe lower-class environments and experience more fear in their daily life. They tend to think that one should always obey the law.
To me this doesn't suggest that fundamentalism causes crime, but that crime causes fundamentalism. My picture is that fundamentalism is basically conservatism in the religious field, and given the findings that mortality salience can make people more conservative (see also this popular review and this paper), maybe the cause of the religiousness is simply that these are violent areas (or parts of society)? People with more secure lives do not need the comfort of conservative thinking and cleaving to old values, so they become more liberal.
This also fits in with a study that shows that challenges to fundamentalist beliefs results in increased awareness of death: the faith appears to keep the anxiety at bay. Conservatism and fundamentalism may also be adaptive in bad circumstances if they cause groups to stick together and creates more resilient safety networks (e.g. churches).
Of course, there may be feedback going on here. Areas with higher crime and are less attractive, so they will get less investments and hence tend to remain poor. Fundamentalists are also likely to scare away the creatives, who want areas with tolerance ("the gay index" of success of an urban area). And of course, holding less tolerant views may be a career impairment these days. Poor fundamentalists (in both senses of the word).
I might not be a sociologist, but I play one on the Net.
January 15, 2007
What Enhancements are Available?
 Another thing I did a while ago but maybe should blog is Cognitive Enhancement: A Review of Technology (in PDF). This is the review of enhancement technology I did for the ENHANCE project last year. I plan to extend it vastly this year with all the extra references and fields I have found. Stay tuned.
Overall there is a surprising amount of methods that give enhancement effects, but most are also pretty small. Still, chewing sage chewing gum while playing video games might sum up nicely and maybe even synergistically while still being pretty acceptable means to most. Looking at the initial sketch I made of what cognitive domains and what technologies have been applied (see this workshop report, page 2), there seem to be much space to explore. Both in terms of untested combinations (metacognition, can it be improved by meditation or software?) and in terms of developing the areas where we have evidence of enhancement (if chewing gum improves learning, can we make better learning improvement chewing gums?). Of course, for that to happen we need a better cultural and philosophical understanding of enhancement, since without it there will not be much support for doing the research.
While I'm still talking cognitive enhancement reviews, it is worth mentioning Moheb Costandi's nice review (he is the guy with the Neurophilosophy blog).
January 12, 2007
Mind over Narcotic Matter
 Hastings A, An extended nondrug MDMA-like experience evoked through posthypnotic suggestion, J Psychoactive Drugs. 2006 Sep;38(3):273-83. demonstrates that hypnosis can recreate experiences "36% to 100% similar" to previous drug experiences (Hastings seems to have earlier publications on this too). Neat example of how much our minds can emulate (or convince themselves they are emulating) complex mental states.
This raises the question whether this kind of hyponosis should be legal. The motivations stated for most anti-drug laws (I'm going to talk from a Swedish perspective here because that is the one I know best) are based on preventing people from addiction and the negative effects of drug-use, but often stated in terms of particular chemicals or mental effects (such as producing euphoria, see narkotikastrafflagen §8). If hypnotically produced states mimic drugs well enough they could exhibit euphoria and in principle be both addictive and potentially health-damaging (at least by eliciting irrational behavior). In that case they would fulfill at least the criteria by Swedish law to be drugs, except of course that there is no physical substance. I have a hard time believing that one could arrest a hypnotist for suggesting to people that they behave in a particular way, especially since this particular kind of behavior is a non-specific internal state rather than an order to do a particular thing. Conversely, it seems strange to think that the rather puritan Swedish laws would not change if people were getting happy from street hypnotizers.
Should the means used to bring about a mental state matter? If I'm hallucinating and chummy, does it matter whether I got so through a drug, hypnosis or TMS? To some extent the means may matter in terms of health risks (a big part in the Swedish legal definitions of drugs at least) and addictiveness. Hypnosis might be a sufficiently safe form of producing weird mental states that there is nothing to criticise there. But it seems to me that there is a need to not just get out of list-based definitions of drugs but also the assumption that a drug has to be a chemical. We will likely get technologies enabling very interesting, useful and potentially dangerous mental states in the near future.
What should be avoided is not the taking of chemicals or achieving odd states of mind, but avoiding addiction. Addiction is a form of mis-learning that reduces human freedom of action. It is not necessarily tied to a chemical: there are clearly many addictive behaviors, be they sex, shopping or some forms of religion.
A future "anti-addiction" law might instead restrict activities and technologies that can induce addictive states in the user. That is really the only part of drug use and mind-hacking that really needs legislation beyond the obvious safety concerns. This might enable a smarter policy of reducing the harm of drug (and hypnosis) use, putting in the effort where it really is needed.
January 11, 2007
Cute Robots, Nietzsche & Covenant: More Forwards Please
 I saw Honda's "More Forwards Please" ad on a billboard yesterday when I was in London to talk at the London Science Museum about cognitive enhancement (and AI). This is the more forwards please video. Very fitting.
Who can resist cute robots being well-behaved museum visitors? The whole pro-progress theme reminds me of Daewoo's great slogan:
We move because we hate the idea of standing still.
We create because we want something new in our life.
We take the next step because we want to rise above.
This is our mission, this is our passion.
The sceptical postmodern westerner immediately interjects: but to what end? All 'progress' isn't good! What is the content and context of all this?
But I think it misses the point. These two statements (besides trying to show that Honda and Daewoo are nifty and shiny) really expresses the true spirit of Nietzsche's concept of the 'will to power'. It is the will to become more, to expand oneself, be creative and use all one's abilities. I think it can almost be seen as a way of expressing flow although to Nietzsche it was much more, something acting both on lumps of matter and societies ("everything strives").
As Covenant sings in "Luminal":
I try to rise in pride, I want to radiate
walk on water and ride the light
I try to break the chains, I want to penetrate
cross the borders and drink the oceans
I need to burn my fuel, I want to detonate
melt the sun and drain the sources
I need to waste my strength, I want to escalate
turn the tide and conquer the stars
A pretty clear expression of the will to power.
It is amusing that most people who reflexively question the drive for "more forwards" think they are informed by the post-modern project. Because that project was to some extent built on the foundations of Nietzsche, and claims to accept a multiplicty of perspectives. How come progress must then be criticised so fiercely? To some extent it is of course the old struggle with modernism. But I think deeper down there is a conflict between a static, "the world should be as it is (and was meant to be)" view of the world and a dynamic "futurist" view that thinks "change is good". The traditional conservative, the communitarian who wants everybody cuddled down in a healthy community, the poststructuralist arguing against the precendence of any particular world interpretation, the romanticist environmentalist and the society-machine tinkering technocrat all think the current system is good or at least a safe bet. They might argue about the roles and ideal levels of religion, schooling, community, technology and economy, but they all agree on that truly new and changing things are disturbing or threatening. Meanwhile the dynamist loves change, because it means possibilities (change is always on the side of those who have no established position in the system), complexity and self-expression. Much of the "educated" scepticism against "naive progress" or "change for change's sake" is probably more about protecting positions and identities than a serious criticism. What would Nietzsche say?
I think change for change's sake has an undeservedly bad reputation. I think we need it to stay human. It is zest for life and learning. Anything new means that the range of human possibility has expanded a bit more, that there are more modes of human existence. And outside ourselves, the universe expands too:
I am not interested in things getting better; what I want is more: more human beings, more dreams, more history, more consciousness, more suffering, more joy, more disease, more agony, more rapture, more evolution, more life. David Zindell
January 10, 2007
Happy Danes and the Future of Medicine
My first CNE blog for the year deals with all the goodies in the Christmas issue of the BMJ.
I have come to look forward to the BMJ at Christmas since it is not just a source of fun papers but also often dares to think outside of the box at least once a year. Maybe more journals should institute a tradition like this, perhaps staggered across the year?
Zombie evolutionary epidemiology
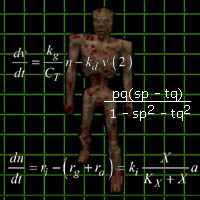 Normally I loathe zombie stories. But the excellent Dinosaur Comics brings up zombie epidemiology. Fast-moving, efficient zombies ought to be good at eating their victims, resulting in just the initial zombies and nobody else in the vicinity. Inefficient slow zombies might just be able to bite their victims and hence produce more zombies, but they are unlikely to be able to spread since they are bad at catching anyone. Ergo, no risk of zombie epidemics.
I think Rex is making a mistake in his reasoning. First, there is of course always a slight chance of incompetence from efficient zombies and competence from inefficient zombies. This will lead to growth in any case.
Second, there might also be an evolutionary pressure on zombies. Assuming zombieness is in some sense heritable (why not? nothing about zombies makes sense anyway), there would be an evolution towards reduced virulence (i.e. biting, not killing as often). This is just as how many non-vector transmitted diseases evolve towards more benign forms where the host is not killed (diseases transmitted by vectors on the other hand have a weaker incentive to become less virulent). So the initial zombies would evolve towards an optimal speed to injure enough people to keep the spreading high, but not be too efficient. Maybe this is the "Hollywood optimum", since it provides with maximum uncertainty of the survival of the heroes.
I did a little simulation of this. Zombies start out with uniformly distributed efficiencies. Each turn a zombie has a chance of catching a human equal to its efficiency. If that happens there is another chance equal to 1-efficiency that the human is not eaten but instead becomes a zombie with efficiency equal to its "parent" plus a normally distributed change with standard deviation 0.1. The simulation continues until there are 100,000 zombies from the initial population of 10.
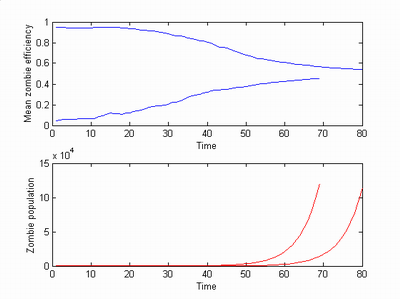
Both an efficient population and an inefficient evolve towards the "optimal" efficiency of 0.5. The population curves are exponential, but due to initial luck different zombie infestations may take a different amount of time before exploding.
Plotting the distribution of efficiency shows a nice evolution towards a normal distribution (with two deltas at the ends due to me keeping efficiencies above 0 and below 1 artificially).

Zombies actually evolve towards a very diverse population, with some zombies very fast and some very slow even if the majority is optimal. This might be relevant as the situation changes. If there are many people around the optimal efficiency is lower than 0.5, since each zombie still has plenty of chances of attacking someone. After most people have turned to zombies fast zombies have more fitness (pun not intended) since they are better at getting the few survivors.
Adding this to the simulation in the form of having the capture probability be proportional to efficiency*sqrt(humans/zombies) I got the following result (humans in green):
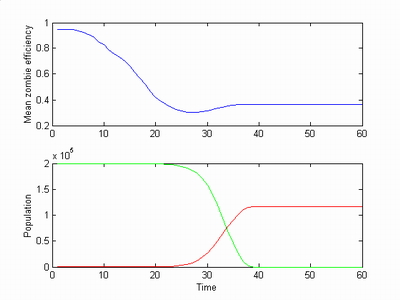
At first the very fast zombies expand, evolving towards ever more shuffling zombies while the humans are plentiful. Once the human population starts to decrease appreciably the zombies begins to evolve towards faster zombies again. But now there are so few humans left that the plentiful old zombies get them anyway and the evolution stops before it gets very far.
Next week: coalescent theory and vampire lineages.
January 07, 2007
One Year of Omega
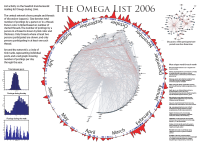 Here is a visualization (PDF) of the activity on the Swedish transhumanist mailing list Omega. I played around with plotting both list activity over time, who responded to what threads, when posts were made and what words were unique for particular months.
As the central network shows the posting intensity of different people is roughly a power-law, dominated by a very talkative yours truly. For clarity it leaves out posts that had no replies, representing mentions of news and webpages, threads that never take off etc. The tint of the posters represent the amount of such hidden posts, distinguishing responders from originators.
Making a sociogram of a mailing list based on who replies to who is IMHO somewhat noisy, at least for a small idea-based list like this one. People respond to threads rather to people, although some people are better than others at eliciting a response. Filtering rather harshly as in the top right graph brings out what I think is a good essence of the list.
The interval between postings turned out to be nicely lognormally distributed. The posting pattern during the week on the other hand shows fun oscillations depending on day of week and time. The red histogram on the circle shows that traffic is rather bursty. The February peak was a debate about economics and whether technocracy could work, the August peak was a combination of discussion about home-schooling and the Nobel prize.
The word extraction was fun to do. I counted occurences of each word across the year and for each month, showing the 10 most common words that just occured in a single month. In fact, I gathered words from several years on the list, so these words distinguish these months from all previous history. The method works although it might need some more filtering to deal with misspellings (repeated through comments) and occasional oddities like the thread in November where people were writing backwards.
January 06, 2007
Conlang sizes
While looking for the lexicon size of Lojban I found Category:Conlangs by Lexicon Size - Langmaker and decided to plot lexicon size of a number of constructed languages versus their rank (i.e. by size order).
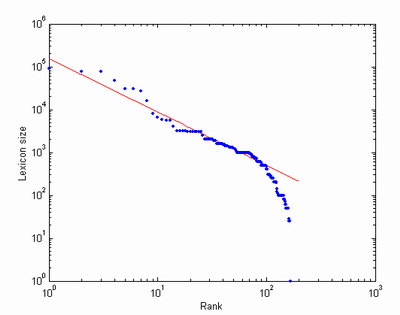
Surprise! A power law seems to be involved, at least for languages bigger than 100 words. I get an exponent of a=-1.2420, which in turn implies that the frequency of conlangs of size S scales as S-1.8052 (see here for explanation). Maybe I should rush off and send a paper to Nature? :-)
Addendum: Arnt Richard Johansen asked whether there was a correlation between conlang popularity and vocabulary size. Plotting the popularity ranking versus the size we get a nice cloud of uncorrelated points:
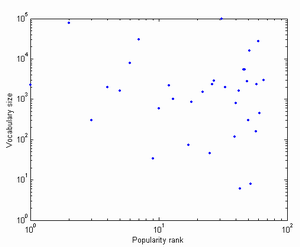
(same thing when using the direct popularity scores) Looking at the popular languages suggests that many of them are popular for being referred to in films, novels or games rather than actual use.
On the other hand, popularity score vs rank looks like a power-law with exponent is -0.4105.
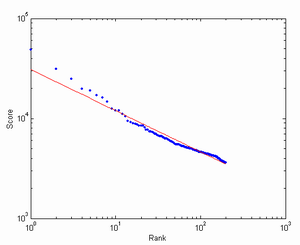
I haven't found any good (i.e. big) dataset on number of speakers, but given that few conlangs have huge communities I would expect a lot of statistical noise due to the many one-person languages.
January 03, 2007
Letter substitution graphs and percolation theory
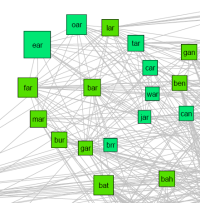 An old game is to take a word and substitute one letter to make a new word, and then continue until you end up with something completely different (i.e. from 'old' to 'new'). I remember reading about it in Scientific American many years ago, and it may originate with Lewis Carrol although he allowed insertions, deletions and permutations. It becomes more manageable if only substitutions are used, since then just words of the same length are possible to transform into each other.
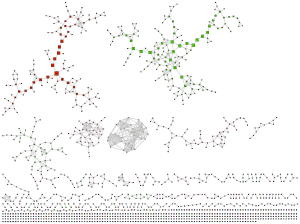
Recently I was asked to look into the network properties of Lojban gismus (why? for secret and mysterious reasons, of course :-). I wrote a little program to check 1-letter substitutions and if they resulted in another valid word a link was added between them. The resulting graph can be found here as PDF.
It fits with the earlier description, a number of disjoint subgraphs ranging from a few very large one to an archipelago of isolated words. An interesting feature is that while most parts of the network are tree-like, some are much more densely connected. Is this a normal feature of languages, or an artifact of Lojban's artificiality?
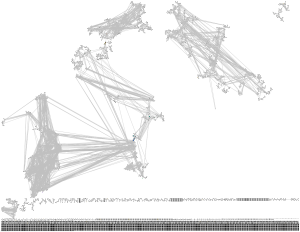
I tried it on English. Using SCOWL 6 with British spelling and words on lists up to 70, I put together graphs for 2-letter, 3-letter, 4-letter, 5-letter and 6-letter words. In these cases the graphs are above the percolation threshold and densely connected with only a few tree-like parts and unlinked clusters.
In general, if we have an alphabet of size A and look at length N words, the space of possible words is AN large and each word has just (A-1)N neighbours. Hence the fraction of neighbours declines nearly exponentially. The number of W(N) real words looks like a Poisson distribution with a peak around N=8 for English.
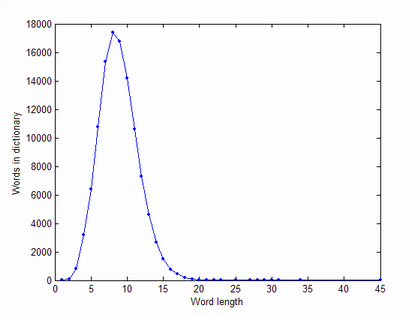
The chance that a given word has at least one neighbour is, assuming independent probabilities, P(N)=1-(1-rho(N))(A-1)N where rho(N)=W(N)/AN is the density of words. The result is a pretty rapid decline for increasing N, that soon crosses the percolation threshold 1/W(N):
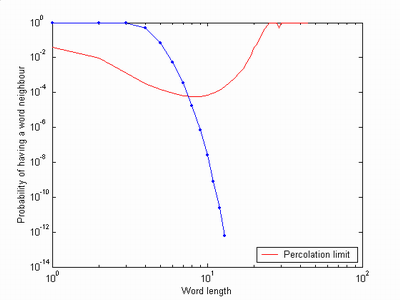
We should see a breakup of the clusters between length 7 and length 8 words, which also happens.
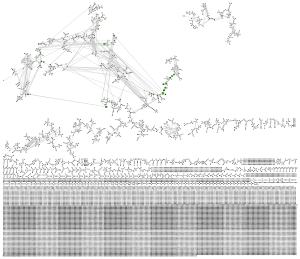
The giant component for length 7 words looks a bit fragile and has lost a sizeable cluster, and at length 8 it has turned into a cloud of clusters:
Beyond, the graphs become even more disjointed; among length 10 words the largest cluster is just 24 words large (fittingly enough, it is the words that can be reached from 'clustering') and most "clusters" are one or two words.
Since Lojban has a much smaller lexicon (about 8000 according to Langmaker) it may not be surprising that even the root words form a cloud of clusters. The distribution and individual graphs also looks a bit like the length 8 graph. The inhomogenities seen in both are likely due to the pecularities caused by phonology, making some letters likelier alternatives to each other because they correspond to similar sounds. As Lojban grows I expect it to reach percolation in a few hundred to a thousand more words, unless pecularities of design prevent it.
As an aside, I feel inordinately proud to find my warning sign in lojban!


