January 22, 2007
Teasing out the Social Web
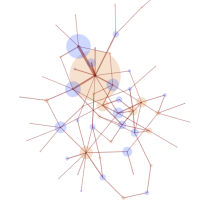
 As an exercise in Processing I wrote a small app to visualize the interactions on a mailing list.
The applet reads a locally stored copies of list traffic, connecting people with the threads they post to. In order to avoid cluttering only repeated interactions are shown. The network is run as an interactive force-layout where the user can pull nodes, anchor them and zoom around.
I have found that networks are usually very hard to understand when just viewed passively. That is why I wanted to make this interactive. Anchoring is a very practical method of stretching out the social network to see who is most closely tied to whom or what discussion.
I used local copies of the traffic in order to avoid the hassle of signing the applet. A future version ought to read directly from the list archives. Right now it only covers April 2006 to middle January 2007, but there is plenty of variation from month to month already in this small set. January is dominated by a huge discussion, August has very low traffic and the 2006 spring networks look denser than the autumn ones.
Posted by Anders3 at January 22, 2007 02:23 AM