March 23, 2010
The food is growing on the plates
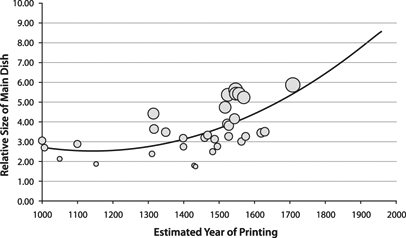
Here is a fun use of image processing: checking trends in how portion sizes in depictions of the last supper have changed. International Journal of Obesity - The largest Last Supper: depictions of food portions and plate size increased over the millennium (Wansink & Wansink, doi: 10.1038/ijo.2010.37). The authors note that the relative sizes of the main dish, the bread and plates has increased over the last millennium. They think this relates to an increased salience of food in culture.
In general, estimates of portion sizes tends to be larger in hungry individuals. However, we may over or underestimate portion sizes differently for different food. Hence, there could be a lot of things going on here - different "normal" portion sizes for the painter and audience, different kinds of food, different hunter levels, different ideas of what constitutes a meal and even different views of which point in the last supper is worth depicting.
The authors claim a linear increase in portion sizes, but in their figure they have fitted a concave curve. Maybe they have found a new exponential to add to Kurzweil's quiver of curves: as we approach the singularity we will be more and more food-obsessed? :-)
March 22, 2010
Reporting Risks
 WEF Risks 2010: an interactive map of risks, as analysed by the World Economic Forum 2010 (report (pdf) here).
As infographics goes this is pretty nice. One gets an overview of what is linked to what, the estimated likelihood, severity and connection strengths. Clicking on a risk brings up the risks linked to it, and so on.
As risk estimation it is more problematic. What does it mean that nuclear proliferation ("Multiple states pursue nuclear armament, with associated increase in geopolitical tensions") has a 10% likelihood or chronic disease ("Chronic diseases spread rapidly throughout the developed and developing world, driving up health costs and reducing productivity and economic growth") has 20% over a ten year time period? I think we can say the likelihood of both are 100%, it is just that they are not as bad as they could be.
The problem is that the network weights and node strengths were determined by surveying various experts, and they most likely have very different views of what constitutes a real risk. Worse, it was not possible for the surveyed experts (I was one of them) to add new risk nodes. Given past experience with e.g. the Cuba crisis I think it would be unwise to give nuclear war a much lower probability than 1% per year, but this ~1-10% global catastrophic risk is not even on the list! While nanoparticles are on the list toxicity from pollution (a broader category) is not. And so on.
I expect the main reason for the risks listed are that they are what people going to the world economic forum like to discuss. Asset price collapse, food price volatility, Afghanistan instability and climate change are comfortable subjects. I suspect the risks were originally selected by what a WEF-related expert group felt were important, and that will of course bias how the respondents to the latest survey will respond. While no doubt making the WEF happy (and yes, most of these risks are worth discussing) there is a serious risk that the report will just help us watch for the same old risks. It does not help against black swans, and it seems hard for outsiders who might have candidate risks to get them in.
Maybe what we really need is a wikidisaster where anybody can propose risks and people can vote on them. Ideally combined with an prediction market that forces people to put the money where their mouths are.
March 11, 2010
More cognition enhancement in the media
 The Daily Mail has had an article on cognition enhancers, with their typical slant: Illegal 'smart drugs' bought online by teenagers before exams could have catastrophic effect on their health. Unsurprisingly taking a lot of stimulants and not sleeping is bad for you. I'm quoted there, of course, promoting responsible use.
It also led to an interview on BBC Oxford, but I can't find it on-line.
To survive one's profession
I discuss the future of youth unemployment in Kvällsposten: Att Överleva Sitt Yrke (in Swedish).
My main point is that demographic change leads to differences in what jobs and careers mean: less transfer of wealth from older generations to younger, companies and even jobs survive shorter than individuals. Hence we need to enable more youth entrepreneurship and flexibility on the job market, or we will end up with a very stiff gerontocracy.
March 07, 2010
Corrupting the Youth
 I am in the Oxford student newspaper: Uni scientist advocates ‘smart drugs’ for students - OK, they sexed up the title a bit, since my long list of ethical and practical caveats would have made a lousy title ("Uni scientist advocates taking smart drugs if you, after studying the evidence and evaluating your ethical stance, use them responsibly with informed consent and an eye towards what kind of social game a university is").
Currently in Lugano, where the enhancer of choice is of course espresso.
March 04, 2010
The sun rises more surely with Jeffreys than Laplace
 The sunrise problem is one of the perennial problems of probability and particularly relevant for the research we do at FHI: how do we estimate a probability for something we have never seen?
The "classic" solution is Laplace's rule of succession that provides us with the answer that if we have seen N sunrises, the probability for another sunrise tomorrow should be (N+1)/(N+2).
This can be calculated this way: Seeing N out of N possible occurrences of an event with true probability p has probability p^N. If we know this has happened, we have a probability distribution for p of the form (N+1)p^N, where the (N+1) terms is a normalization constant. Calculating the expectation for p we get (N+1)/(N+2).
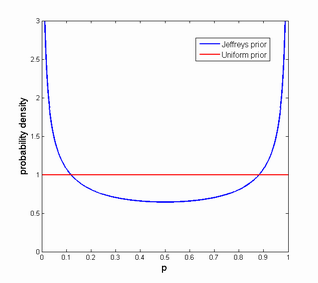
However, this assumes an uniform prior over p: each probability is equally likely (the principle of indifference). While this might seem reasonable, probabilities in the real world tend to either be very small (something almost never happens) or very large (it almost surely happens). Worse, when estimating probabilities we are often interested in order of magnitude rather than absolute values. But a uniform distribution over log p is not uniform over p.
One approach to this is to use an "un-informative" prior, a prior estimate that expresses our uncertainty but is also invariant over the transformations we might think are reasonable for the problem. In this case the Jeffreys prior seems useful. In particular, the version of it (it has a different version for different problems) we want is the one used for estimating a biased coin, J(p) = 1/sqrt(p(1-p)).

Plugging the prior into the previous analysis and using Bayes' rule we get
P(p | having seen N out of N) = (N+1)p^N J(p) / integral01 (N+1)p^N J(p) dp
Unfortunately the integral below the denominator is a messy hypergeometric function. The forms for integer N are simpler (no hypergeometrics) but still unwieldy.
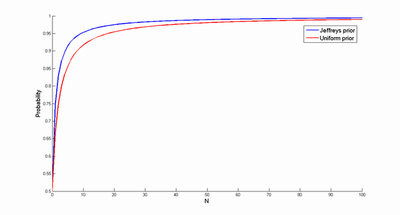
Using numeric integration instead produces the following probability estimates (care must be taken when integrating close to 0 and 1, since J(p) is badly behaved there. Whee!)
The blue curve is using the Jeffreys prior, the red Laplace. So if we believe this prior is better than the uniform one, we will be more confident that the sun will rise tomorrow. Which is a bit surprising, given that the prior actually puts much of its probability mass close to zero. But that part of the prior quickly gets "overruled" by the N observations, amplifying the effect of the other big lump of probability mass near 1.

