December 14, 2011
Fun with Ikeda
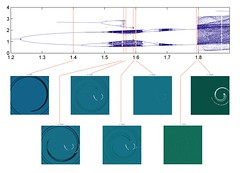
 I have been having fun plotting bifurcations and crises in the Ikeda map.
It all started when I did an entry on Wikipedia for crises in dynamical systems, and then I realized I needed an illustration. The Ikeda map is pretty good for this, since it has plenty of crises.
Posted by Anders3 at December 14, 2011 07:19 PMComments