January 22, 2014
Evidence for same-sex marriage associated with floods in Sweden
Recently David Silvester, a UKIP town councillor, has found himself in stormy weather after he wrote a letter to the Henley Standard arguing: “Since the passage of the Marriage (Same Sex Couples) Act, the nation has been beset by serious storms and floods.” He went on to argue that the law would cause disaster and “The scriptures make it abundantly clear that a Christian nation that abandons its faith and acts contrary to the Gospel (and in naked breach of a coronation oath) will be beset by natural disasters such as storms, disease, pestilence and war.” Needless to say, widespread ridicule and condemnation occurred and he was suspended from his party.
Of course, some might argue that I, being one of those horrible gay immigrants taking UK jobs, might have some bias against the councillor. But we should acknowledge that he at least has a falsifiable hypothesis. While one might amuse oneself like The Guardian by coming up with ways gay marriage could cause flooding there are plenty of natural experiments that can be tested.
Detecting divine wrath
Sweden legalized same-sex civil unions in 1995 and same-sex marriage in 2009. Did the amount of flood events increase?
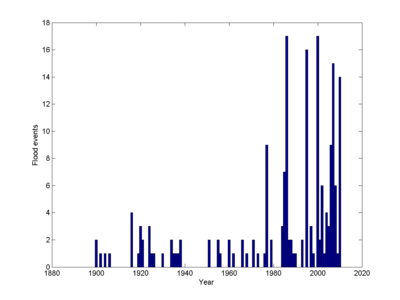
The report Översvämningar i Sverige 1901–2010 from the Swedish Civil Contingencies Agency lists major flood events. Looking at the basic data suggests that there is a great deal of difference between the period before the 1970s and after. While this might be signs of increased divine displeasure or climate change, a more likely explanation is simply reporting bias. For my study I will hence look at the period 1980-2010.
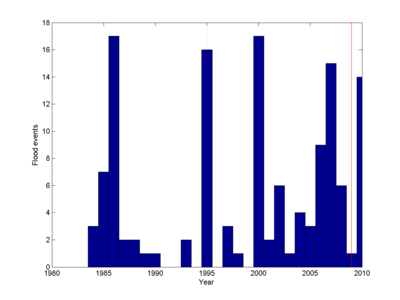
1995 was a flood year, just as Silvester would have predicted. But 2009 wasn't, and this was the year when the Church of Sweden started marrying gay couples. Of course, God might just have signalled resistance at the start, before evolving His views.
Looking at the period 1980-2010 gives 133 flood events over 30 years, or 4.43 per year. In the 15 years before civil unions the rate was 2.33 and in the 15 years with civil unions 6.53. Aha! An increase! Time to repent?
Not so fast. This is noisy data, and we need to make a statistical test of whether the pattern could just have happened by chance. How do we do that?
The most obvious is to regard the events as generated from a Poisson process with an unknown rate. The number for each year would be a random draw from a Poisson distribution.
We want to test whether the rate before 1995 is distinguishable from the rate after. There are a bunch of methods for this (pdf). A simple and classic method is from Przyborowski and Wilenski, who pointed out that given X1+X2=k observations (35+98=133) the number X1 should be binomially distributed. For each flood in the data set, it goes into the first half with some probability p: the number of “successes” X1 will be distributed as Bin(N,p). If there is no change p=1/2. This means we can reject the hypothesis that the rate is the same on both sides when the probability of getting X1 or more successes is lower than some threshold; I’ll use 5% - if it is good enough for social science it is good enough for theology.
Running Matlab’s binofit I get p=0.7368, with a 95% confidence interval [0.6535, 0.8094]. So we can reject the null hypothesis that floods were as common pre-1995 as post-1995! In fact, we can use the extremely conservative 0.00001% threshold and still get a significant result. Ahhh! Doom! Repent sinners, repent!
My weak faith in statistics
OK, what is really going on here is that (1) there might very well be underlying trends (more reporting of recent events, climate change, modified definitions) coinciding with the changes of marital law (like the famous pirate-climate graph), and (2) the darn data is actually not behaving like a proper Poisson process. What I obviously ought to have done before anything else is of course to calculate the mean (4.29 events per year) and compare it to the variance (31.68): had the data been Poisson they should have been close together. They aren't. Clearly more years have far more floods than the Poisson distribution would predict, and this invalidates using the above method here. We can imagine a caricature case where all floods happen on a single random year in the 30 year interval: no matter when it happens, such correlated flooding makes it look like the basic rate of flooding has either gone up or down between the halves.
Just looking at whether there is any reported flooding in a year does indeed produce a null result of no discernible change, but now we have thrown away most data so it is not very impressive.
In fact, I think there is a real difference. Running a Wilcoxon rank sum test I can reject the no-change hypothesis (or more accurately, no change in median number of flood events) at p=0.0258. Not super-certain, but that test is also non-parametric: it does not care what weird distribution my data comes from (it does assume that different years are independent, which might be debated a bit).
Just like one storm does not indicate climate change or divine wrath, a single study is often surprisingly weak. While p-values of 0.00001% may dazzle, the probability that the data is crappy or the statistics applied wrong is pretty high (remember, around 0.1-1% of all scientific papers ought to be retracted). This is why I am not immediately converting: my subjective probability that Silvester is right is only increased slightly by my above findings [see appendix] One should demand several independent experiments. Which, fortunately, seems quite doable if one feels motivated.
There are good reasons why falsifiable theological claims are so rarely done today. When Hojatoleslam Kazem Sedighi claimed immodest female clothing increases earthquakes the result was that female sceptics dressed immodestly, unsurprisingly not producing any extra earthquakes. These claims invite intense ridicule, they can be publicly tested using standard methods, and modern media will transmit the news that they did not work out (although, as creationists and others show, false factoids can also be transmitted well without context – I would not be surprised to see in a few years the claim circulating in fundamentalist circles that a Swedish scientist proved that gay marriage cause floods, conveniently only showing the middle part of this post).
Appendix: Bayesian treatment of my belief
P(Silvester is right|data)/P(Silverster is wrong|data) = [ P(data|Silvester is right) / P(data|Silvester is wrong) ] [P(Silvester is right) / P(Silvester is wrong) ]
The last term, my prior, is a very small number.
Meanwhile, P(data|Silvester is right) is not huge (say 0.75): even if there is a post-1995 increase of floods, it is not terribly consistent. His biblical quotes seem to imply there should be ongoing wrath rather than a mixture of peaks and valleys.
P(data|Silvester is wrong) is modestly high (say 0.5), because because there are plenty of alternative possibilities to divine wrath for an increase in flood incidence.
So the end result is that my prior gets multiplied by approximately 1.5, and I remain an unbeliever.
Now, if more independent studies are done showing that with high reliability countries that approve same-sex marriage do have a significantly increased flood incidence afterwards (or even better, if it decreases in places that ban it - this would actually give evidence for causation rather than mere association) then the ratio [ P(data|Silvester is right) / P(data|Silvester is wrong) ] would start to increase. Even if one thinks there is a pretty high probability p that each study is wrong, if N independent studies point in the same direction the probability that all of them are misleading is p^N – it soon gets very small, upping the ratio correspondingly.
Note that we can get even more data by looking at wind-storms, epidemics and wars too: each studied country could potentially provide four data streams. However, independence is problematic.

