Pew Research has posted their Morality Interactive Topline Results for their spring 2013 and winter 2013-2014 survey of moral views around the world. These are national samples, so for each moral issue the survey gives how many thinks it is morally unacceptable, morally acceptable, not a moral issue or whether it depends on the situation.
Plotting countries by whether issues are morally acceptable, morally unacceptable or morally irrelevant gives the following distributions.
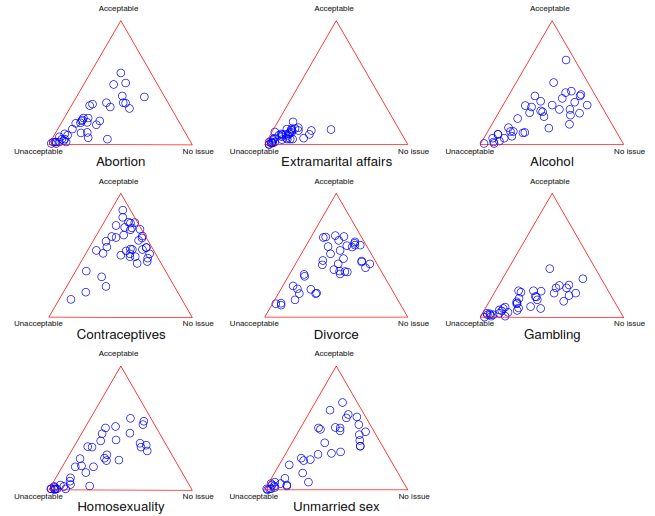
Overall, there are many countries that are morally against everything, and a tail pointing towards some balance between acceptable or morally irrelevant.
The situation-dependence scores tended to be low: most people do think there are moral absolutes. The highest situation-dependency scores tended to be in the middle between the morally unacceptable point and the OK side; I suspect there was just a fair bit of confusion going on.
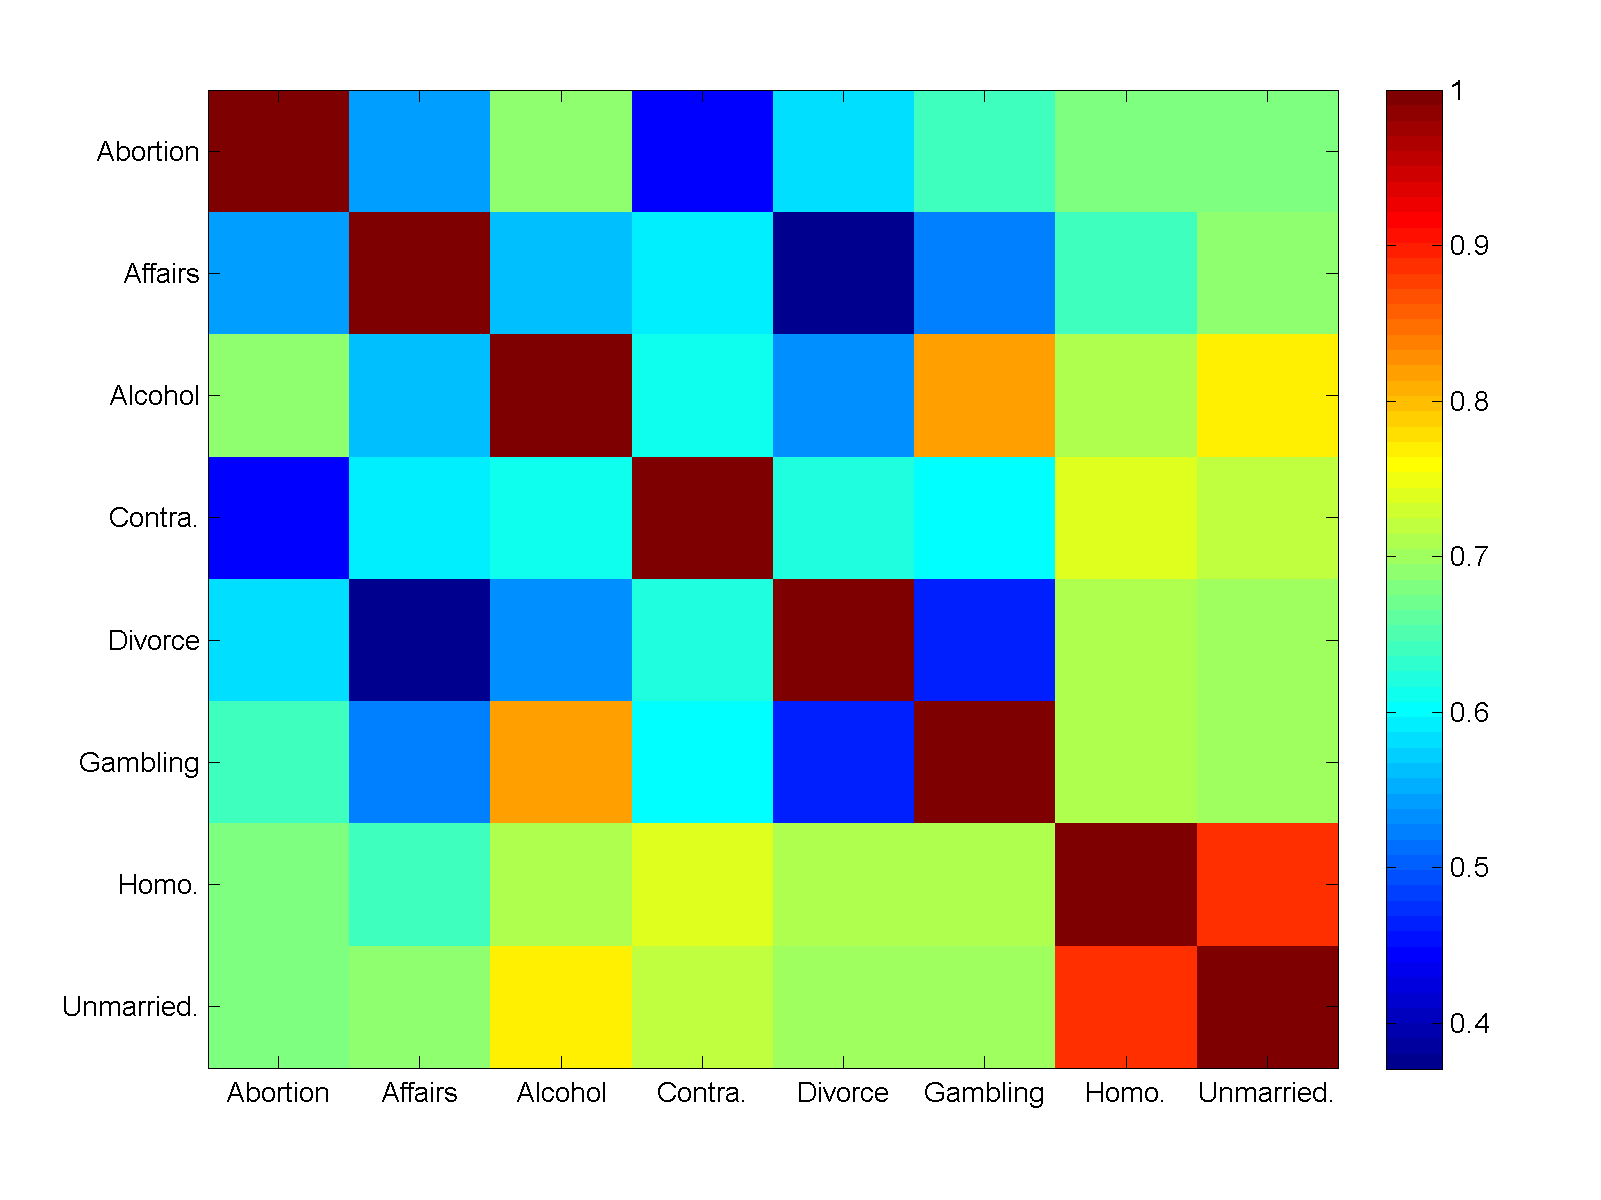
Looking at the correlations between morally unacceptable answers suggested that unmarried sex and homosexuality stands out: views there were firmly correlated but not strongly influenced by views on other things. I regard this as a “sex for fun” factor. However, it should be noted that almost everything is firmly correlated: if a country is against X, it is likely against Y too. Looking at correlations between acceptable or no issue answers did not show any clear picture.
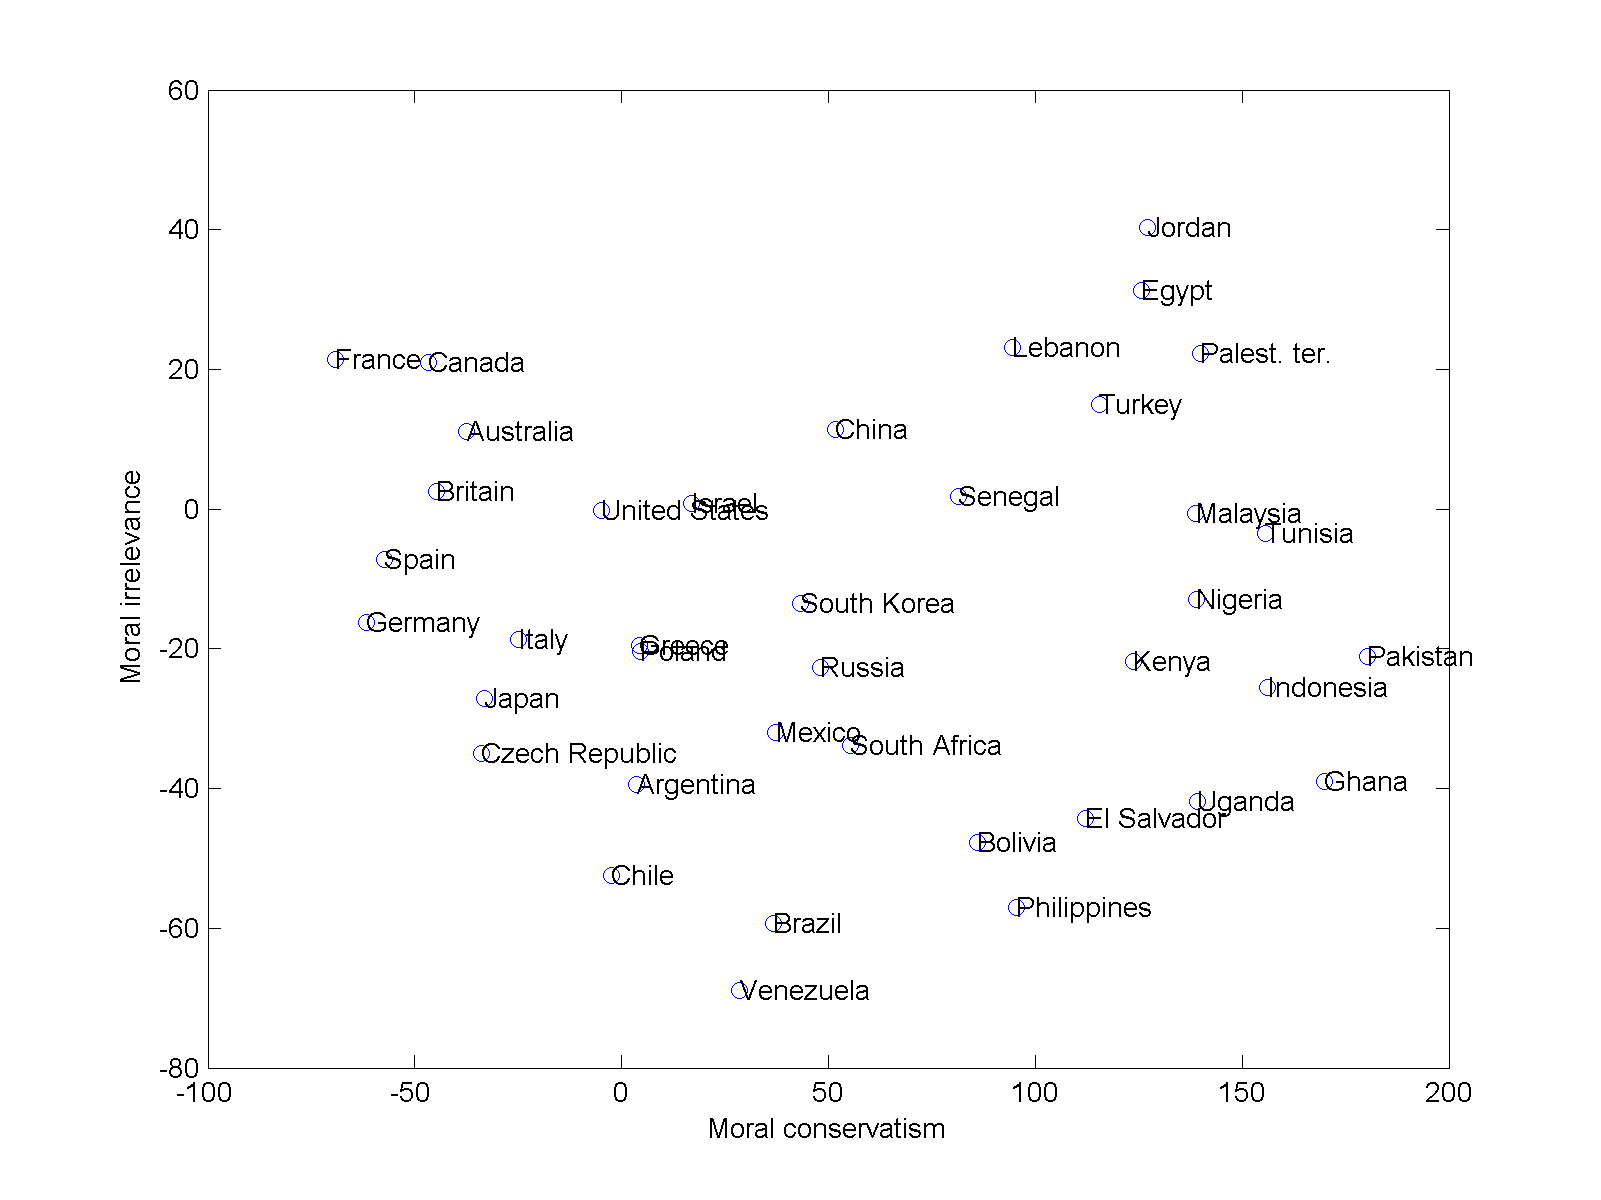
The real sledgehammer is of course principal component analysis. Running it for the whole data produces a firm conclusion: the key factor is something we could call “moral conservatism”, which explains 73% of the variance. Countries that score high find unmarried sex, homosexuality, alcohol, gambling, abortion and divorce unacceptable.
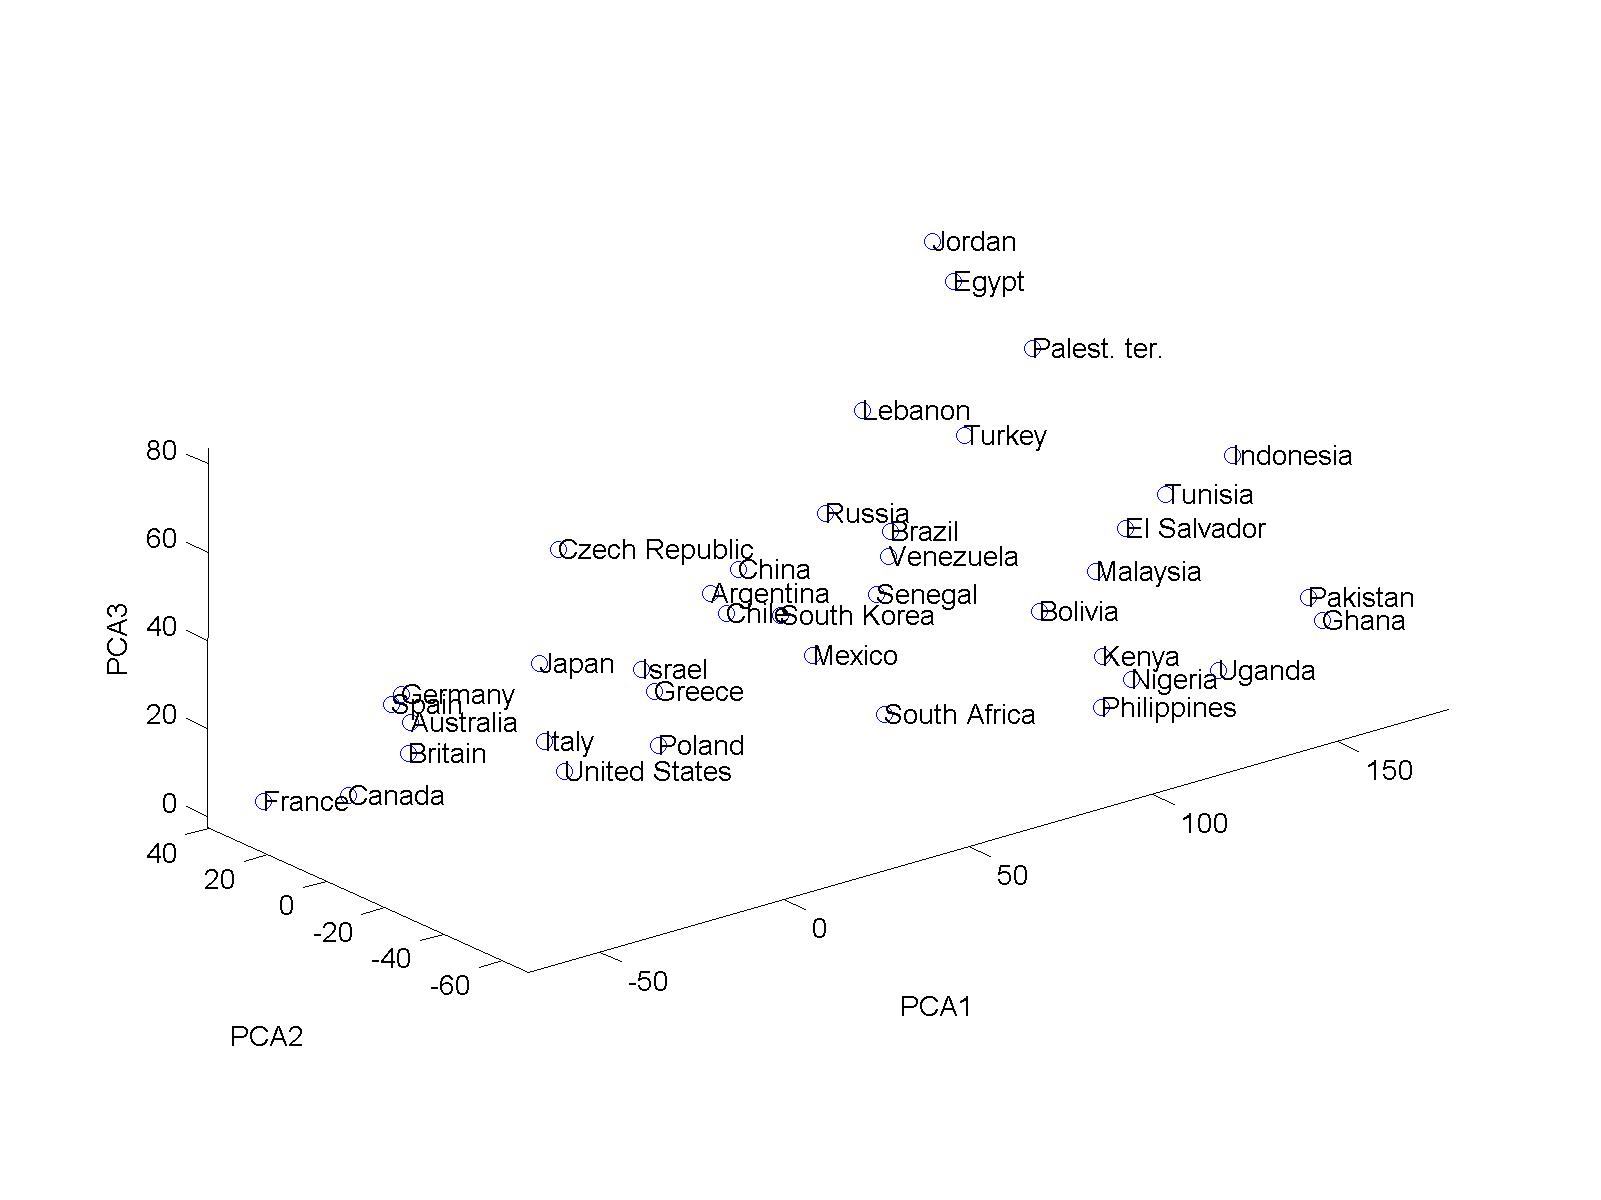
The second factor, explaining 9%, seems to denote whether things are morally acceptable or simply morally not an issue. However, it has some unexpected interaction with whether unmarried sex is unacceptable. This links to the third factor, explaining 7%, which seems to be linked to views on divorce and contraception. Looking at the 3D plot of the data, it becomes clear that for countries scoring low on the moral conservatism scale (“modern countries”) there is a negative correlation between these two factors, while for conservative countries there is a positive correlation.
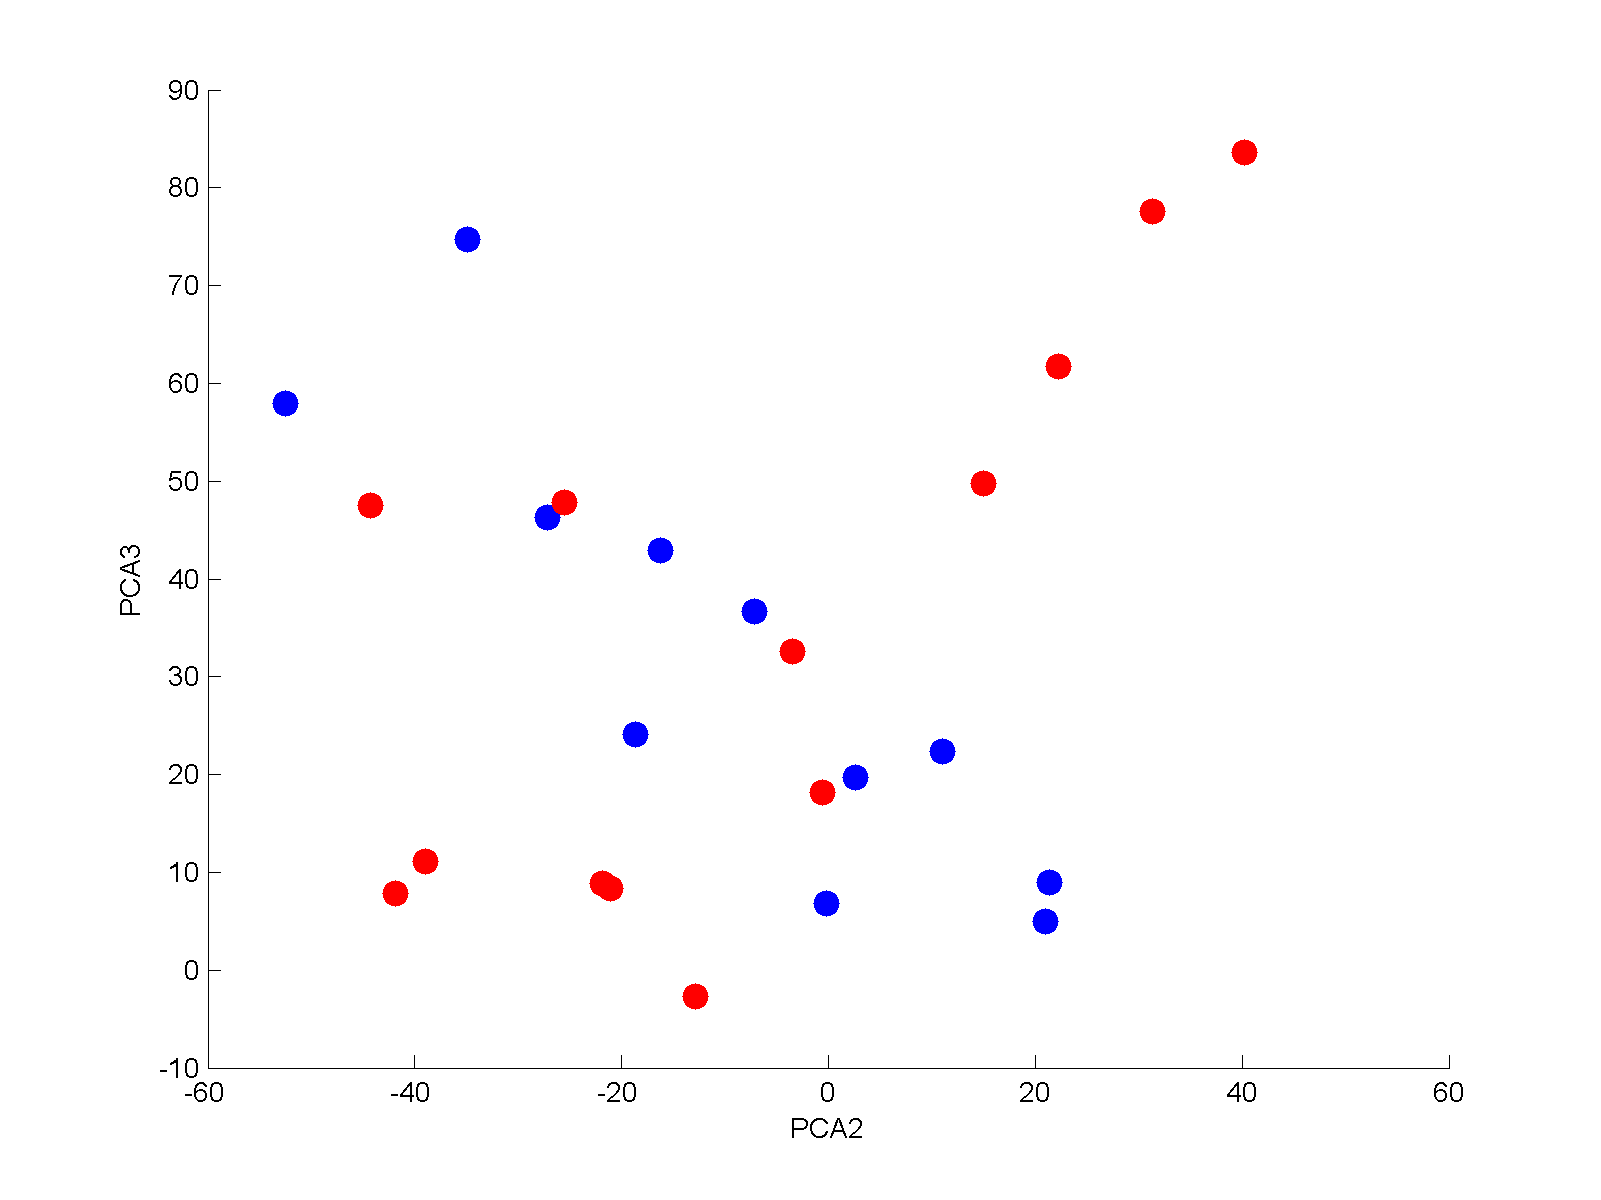
Plotting the most conservative (red) and least (blue) countries supports this. The lower blue corner is the typical Western countries (France, Canada, US, Australia) while the upper blue corner is more traditionalist (?) countries (Czech republic, Chile, Spain). The lower red corner has Ghana, Uganda, Pakistan and Nigeria, while the upper red is clearly Arab: Egypt, the Palestinian territories, Jordan.
In the end, I guess the data doesn’t tell us that much truly new. A large part of the world hold traditional conservative moral views. Perhaps the most interesting part is that the things people regard as morally salient or not interacts in a complicated manner with local culture. There are also noticeable differences even within the same cultural sphere: Tunisia has very different views from Egypt on divorce.
For those interested, here is my somewhat messy Matlab code and data to generate these pictures.
Very interesting, but there is an error: “Palestine” is not a country. “Palestine” can have multiple meanings, all but 1 of which incorrectly describe the entity whose population I assume was measured. Using “Palestinian Territories” as in the data set is a better choice, as it is unambiguous and also not misleading.
Fixed.