I have been working on the Fermi paradox for a while, and in particular the mathematical structure of the Drake equation. While it looks innocent, it has some surprising issues.

One area I have not seen much addressed is the independence of terms. To a first approximation they were made up to be independent: the fraction of life-bearing Earth-like planets is presumably determined by a very different process than the fraction of planets that are Earth-like, and these factors should have little to do with the longevity of civilizations. But as Häggström and Verendel showed, even a bit of correlation can cause trouble.
If different factors in the Drake equation vary spatially or temporally, we should expect potential clustering of civilizations: the average density may be low, but in areas where the parameters have larger values there would be a higher density of civilizations. A low 
Astrophysical correlations
There is a sometimes overlooked spatial correlation in the first terms. In the orthodox formulation we are talking about earth-like planets orbiting stars with planets, which form at some rate in the Milky Way. This means that civilizations must be located in places where there are stars (galaxies), and not anywhere else. The rare earth crowd also argues that there is a spatial structure that makes earth-like worlds exist within a ring-shaped region in the galaxy. This implies an autocorrelation on the order of (tens of) kiloparsecs.
Even if we want to get away from planetocentrism there will be inhomogeneity. The warm intergalactic plasma contains 0.04 of the total mass of the universe, or 85% of the non-dark stuff. Planets account for just 0.00002%, and terrestrials obviously far less. Since condensed things like planets, stars or even galaxy cluster plasma is distributed in a inhomogeneous manner, unless the other factors in the Drake equation produce typical distances between civilizations beyond the End of Greatness scale of hundreds of megaparsec, we should expect a spatially correlated structure of intelligent life following galaxies, clusters and filiaments.
A tangent: different kinds of matter plausibly have different likelihood of originating life. Note that this has an interesting implication: if the probability of life emerging in something like the intergalactic plasma is non-zero, it has to be more than a hundred thousand times smaller than the probability per unit mass of planets, or the universe would be dominated by gas-creatures (and we would be unlikely observers, unless gas-life was unlikely to generate intelligence). Similarly life must be more than 2,000 times more likely on planets than stars (per unit of mass), or we should expect ourselves to be star-dwellers. Our planetary existence does give us some reason to think life or intelligence in the more common substrates (plasma, degenerate matter, neutronium) is significantly less likely than molecular matter.
Biological correlations
One way of inducing correlations in the 
It is not clear how much panspermia could be going on, or if all kinds of life do it. A simple model is that panspermias emerge at a density 


 r^3 \rho}")
The fraction of civilizations finding themselves outside panspermias will be
} = \frac{1}{1+A(e^{(4 \pi/3)r^3 \rho}-1)}")
As A increases, vastly more observers will be in panspermias. If we think it is large, we should expect to be in a panspermia unless we think the panspermia efficiency (and hence r) is very small. Loosely, the transition from going from 1% to 99% probability takes one order of magnitude change in r, three orders of magnitude in
There is another relevant distance beside ![d \approx 0.55/\sqrt[3]{\lambda}](https://s0.wp.com/latex.php?latex=d+%5Capprox+0.55%2F%5Csqrt%5B3%5D%7B%5Clambda%7D&bg=ffffff&fg=000000&s=0 "d \approx 0.55/\sqrt[3]{\lambda}")


![d_{inside}=0.55/\sqrt[3]{A}](https://s0.wp.com/latex.php?latex=d_%7Binside%7D%3D0.55%2F%5Csqrt%5B3%5D%7BA%7D&bg=ffffff&fg=000000&s=0 "d_{inside}=0.55/\sqrt[3]{A}")
If 

So if panspermias have sizes in a certain range, ![0.55/\sqrt[3]{A}<r<0.55](https://s0.wp.com/latex.php?latex=0.55%2F%5Csqrt%5B3%5D%7BA%7D%3Cr%3C0.55&bg=ffffff&fg=000000&s=0 "0.55/\sqrt[3]{A}<r<0.55")
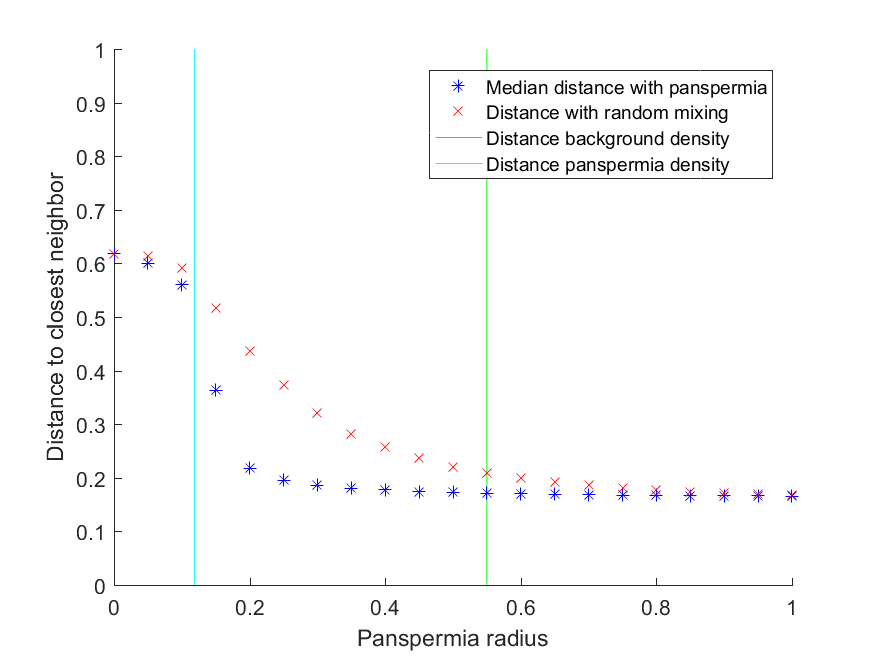
Running a Monte Carlo simulation shows this effect. Here I use 10,000 possible life sites in a cubical volume, and 
Technological correlations
The technological terms 

The basic colonization argument by Hart and Tipler assumes a civilization will quickly spread out to fill the galaxy; at this point 
Total colonization is still compatible with an empty galaxy if
A related model is Brin’s resource exhaustion model, where civilizations spread at some velocity but also deplete their environment at some (random rate). The result is a spreading shell with an empty interior. This has some similarities to Hanson’s “burning the cosmic commons scenario”, although Brin is mostly thinking in terms of planetary ecology and Hanson in terms of any available resources: the Hanson scenario may be a single-shot situation. In Brin’s model “nursery worlds” eventually recover and may produce another wave. The width of the wave is proportional to 


v")
Another approach is the percolation theory inspired models first originated by Landis. Here civilizations spread short distances, and “barren” offshoots that do not colonize form a random “bark” around the network of colonization (or civilizations are limited to flights shorter than some distance). If the percolation parameter 


 \propto |p-p_c|^\beta")


So in this group of models, if the probability of a site producing a civilization is
 = 1-(1-\lambda)^{N|p-p_c|^\gamma}")
for 
")
Temporal correlations
Another way the Drake equation can become misleading is if the parameters are time varying. Most obviously, the star formation rate has changed over time. The metallicity of stars have changed, and we should expect any galactic life zones to shift due to this.
One interesting model due to James Annis and Milan Cirkovic is that the rate of gamma ray bursts and other energetic disasters made complex life unlikely in the past, but now the rate has declined enough that it can start the climb towards intelligence – and it was synchronized by this shared background. Such disasters can also produce spatial coherency, although it is very noisy.
In my opinion the most important temporal issue is inherent in the Drake equation itself. It assumes a steady state! At the left we get new stars arriving at a rate 

Making a temporal Drake equation is not impossible. A simple variant would be something like
}{dt}=N_*(t)f_p(t)n_e(t)f_l(t)f_i(t)f_c(t)-(1/L)N")
where the first term is just the factors of the vanilla equation regarded as time-varying functions and the second term a decay corresponding to civilizations dropping out at a rate of 1/L (this assumes exponentially distributed survival, a potentially doubtful assumption). The steady state corresponds to the standard Drake level, and is approached with a time constant of 1/L. One nice thing with this equation is that given a particular civilization birth rate ")
 = \int_{t_{bigbang}}^{t_{now}} \beta(t) e^{-(1/L) (t_{now}-t)} dt")
Note how any spike in
If we want to do things even more carefully, we can have several coupled equations corresponding to star formation, planet formation, life formation, biosphere survival, and intelligence emergence. However, at this point we will likely want to make a proper “demographic” model that assumes stars, biospheres and civilization have particular lifetimes rather than random disappearance. At this point it becomes possible to include civilizations with different L, like Sagan’s proposal that the majority of civilizations have short L but some have very long futures.
The overall effect is still a set of correlation timescales set by astrophysics (star and planet formation rates), biology (life emergence and evolution timescales, possibly the appearance of panspermias), and civilization timescales (emergence, spread and decay). The overall effect is dominated by the slowest timescale (presumably star formation or very long-lasting civilizations).
Conclusions
Overall, the independence of the terms of the Drake equation is likely fairly strong. However, there are relevant size scales to consider.
- Over multiple gigaparsec scales there can not be any correlations, not even artificially induced ones, because of limitations due to the expansion of the universe (unless there are super-early or FTL civilizations).
- Over hundreds of megaparsec scales the universe is fairly uniform, so any natural influences will be randomized beyond this scale.
- Colonization waves in Brin’s model could have scales on the galactic cluster scale, but this is somewhat parameter dependent.
- The nearest civilization can be expected around
, where
is the galactic volume. If we are considering parameters such that the number of civilizations per galaxy are low V needs to be increased and the density will go down significantly (by a factor of about 100), leading to a modest jump in expected distance.
- Panspermias, if they exist, will have an upper extent limited by escape from galaxies – they will tend to have galactic scales or smaller. The same is true for galactic habitable zones if they exist. Percolation colonization models are limited to galaxies (or even dense parts of galaxies) and would hence have scales in the kiloparsec range.
- “Scars” due to gamma ray bursts and other energetic events are below kiloparsecs.
- The lower limit of panspermias are due to
being smaller than the panspermia, presumably at least in the parsec range. This is also the scale of close clusters of stars in percolation models.
- Time-wise, the temporal correlation length is likely on the gigayear timescale, dominated by stellar processes or advanced civilization survival. The exception may be colonization waves modifying conditions radically.
In the end, none of these factors appear to cause massive correlations in the Drake equation. Personally, I would guess the most likely cause of an observed strong correlation between different terms would be artificial: a space-faring civilization changing the universe in some way (seeding life, wiping out competitors, converting it to something better…)
The stars in a galaxy move relative to one another, such that after a few hundred million years former neighbors will be scattered across much of the galaxy. So if the panspermia radius is less than the size of the galaxy, the distribution of worlds with life will be smoothed out in a time short relative to the time required to evolve intelligence.
Agreed.
The Oort A constant is about 14.8 km/s per kpc. So if we have an initial circular panspermia of radius R kpc, after one galactic rotation the inner edge will be leading by 3.783 R kpc. That is an aspect ratio of about 6:1. If it expands outwards at velocity V kpc/year we can model this by first expanding it and then shearing it (slightly inaccurate, and ignores the diffusive effects of stars on crossing orbits – sounds like a nice simulation problem for an astronomy student!) we would get lead of 3.783 V t kpc and a time until we get an annulus (at the solar orbit the circumference is ~48 kpc) of 6.3/V years. If interstellar dust moves at 26 km/s, V is 2.65e-8 kpc/year and we get an annulus after 236 million years. That is actually way faster than it would take for the dust to go that distance (about 1.8 billion years). So on galactic year timescales only the radial creep matters; it would take 566 million years to get across the entire radial disc (15 kpc) – about two rotations. So panspermias would tend to be galactic on large scale evolution timescales.
The astronomer Carl Sagan speculated that all of the terms, except for the lifetime of a civilization, are relatively high and the determining factor in whether there are large or small numbers of civilizations in the universe is the civilization lifetime, 444 or in other words, the ability of technological civilizations to avoid self-destruction. In Sagan’s case, the Drake equation was a strong motivating factor for his interest in environmental issues and his efforts to warn against the dangers of nuclear warfare .