I have a glass cube on my office windowsill containing a slice of a Calabi-Yau manifold, one of Bathsheba Grossman’s wonderful creations. It is an intricate, self-intersecting surface with lots of unexpected symmetries. A visiting friend got me into trying to make my own version of the surface.
First, what is the equation for it? Grossman-Hanson’s explanation is somewhat involved, but basically what we are seeing is a 2D slice through a 6-dimensional manifold in a projective space expressed as the 4D manifold , where the variables are complex. Hanson shows that this is a kind of complex superquadric in this paper. This leads to the formulae:
where the k’s run through . Each pair
corresponds to one patch of what is essentially a complex catenoid. This is still a 4D object. To plot it, we plot the points
where is some suitable angle to tilt the projection into 3-space. Hanson’s explanation is very clear; I originally reverse-engineered the same formula from the code at Ziyi Zhang’s site.
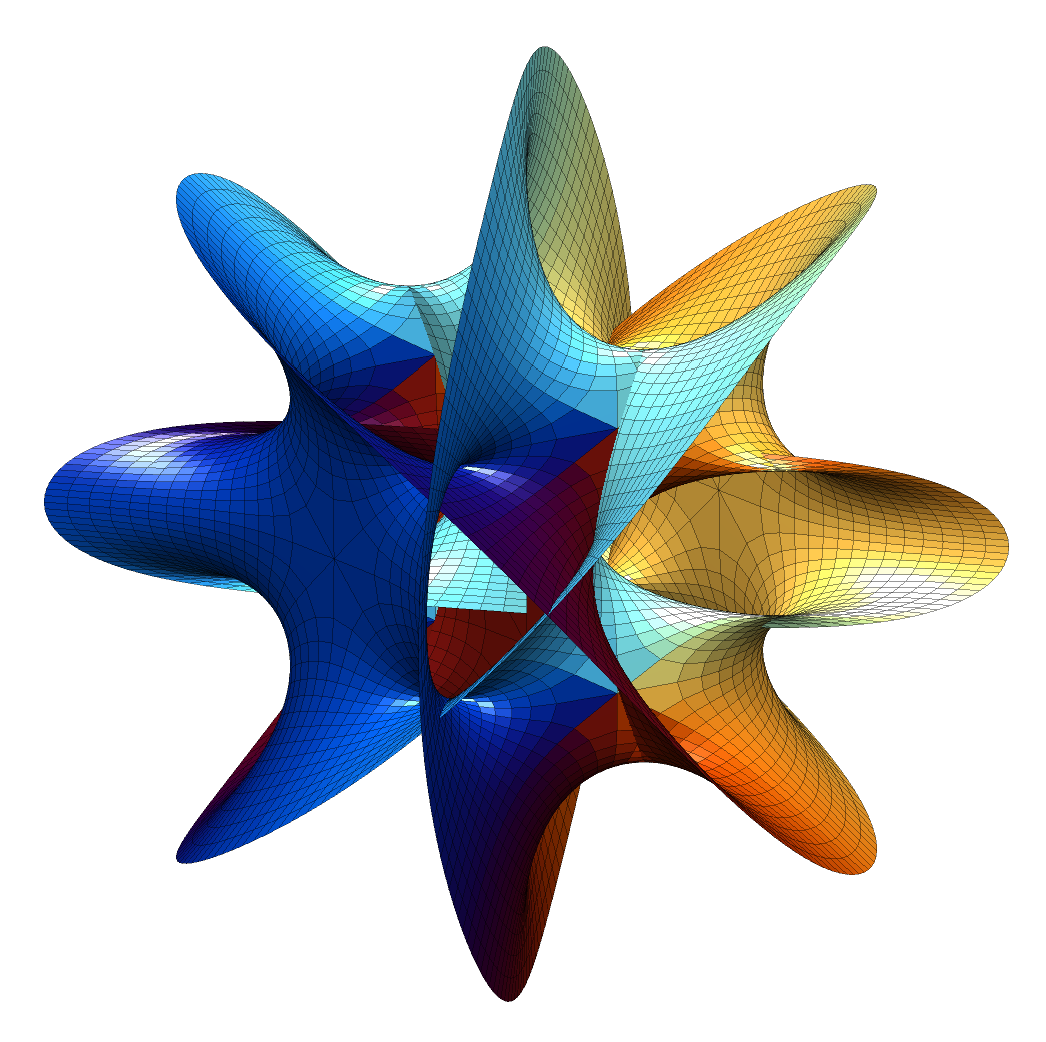
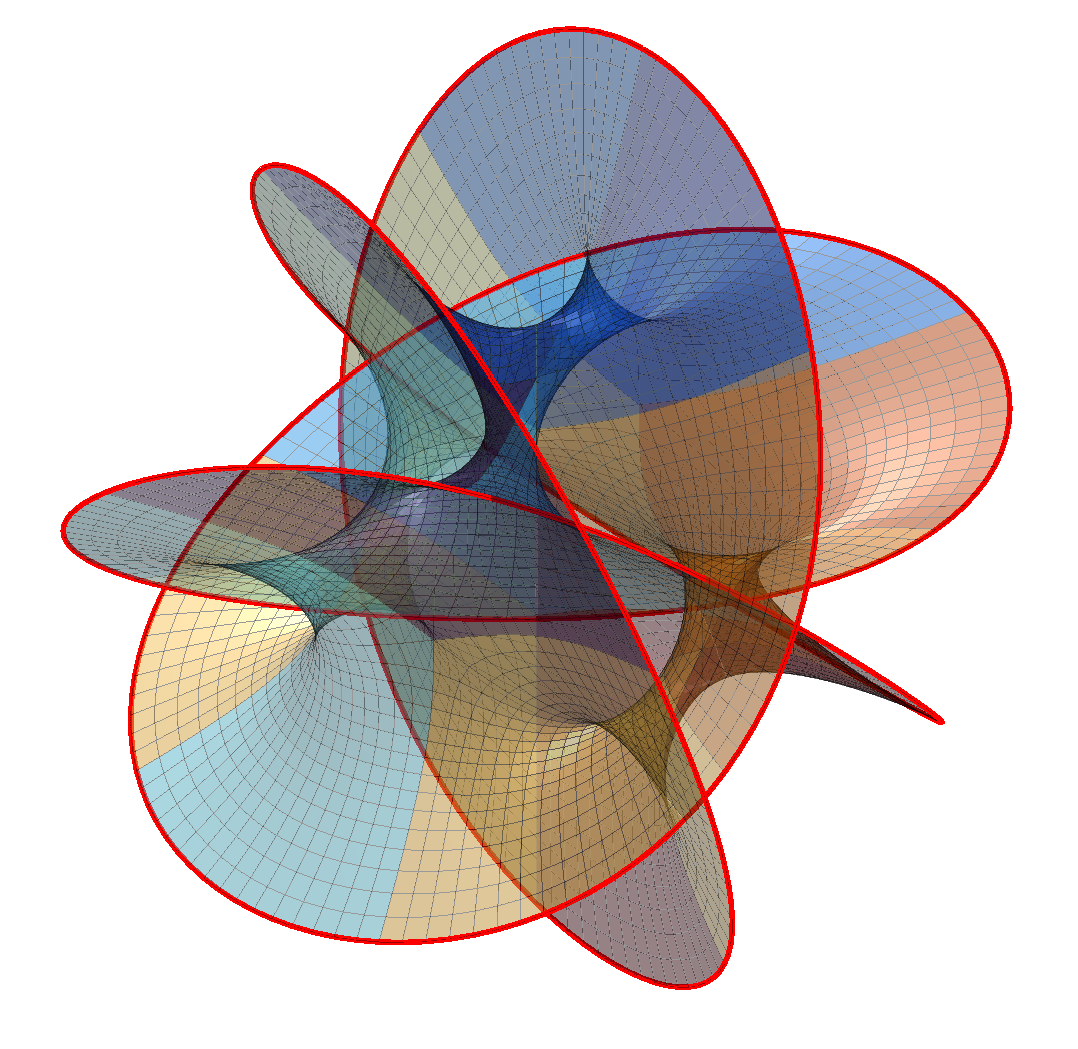
The result is pretty nifty. It is tricky to see how it hangs together in 2D; rotating it in 3D helps a bit. It is composed of 16 identical patches:
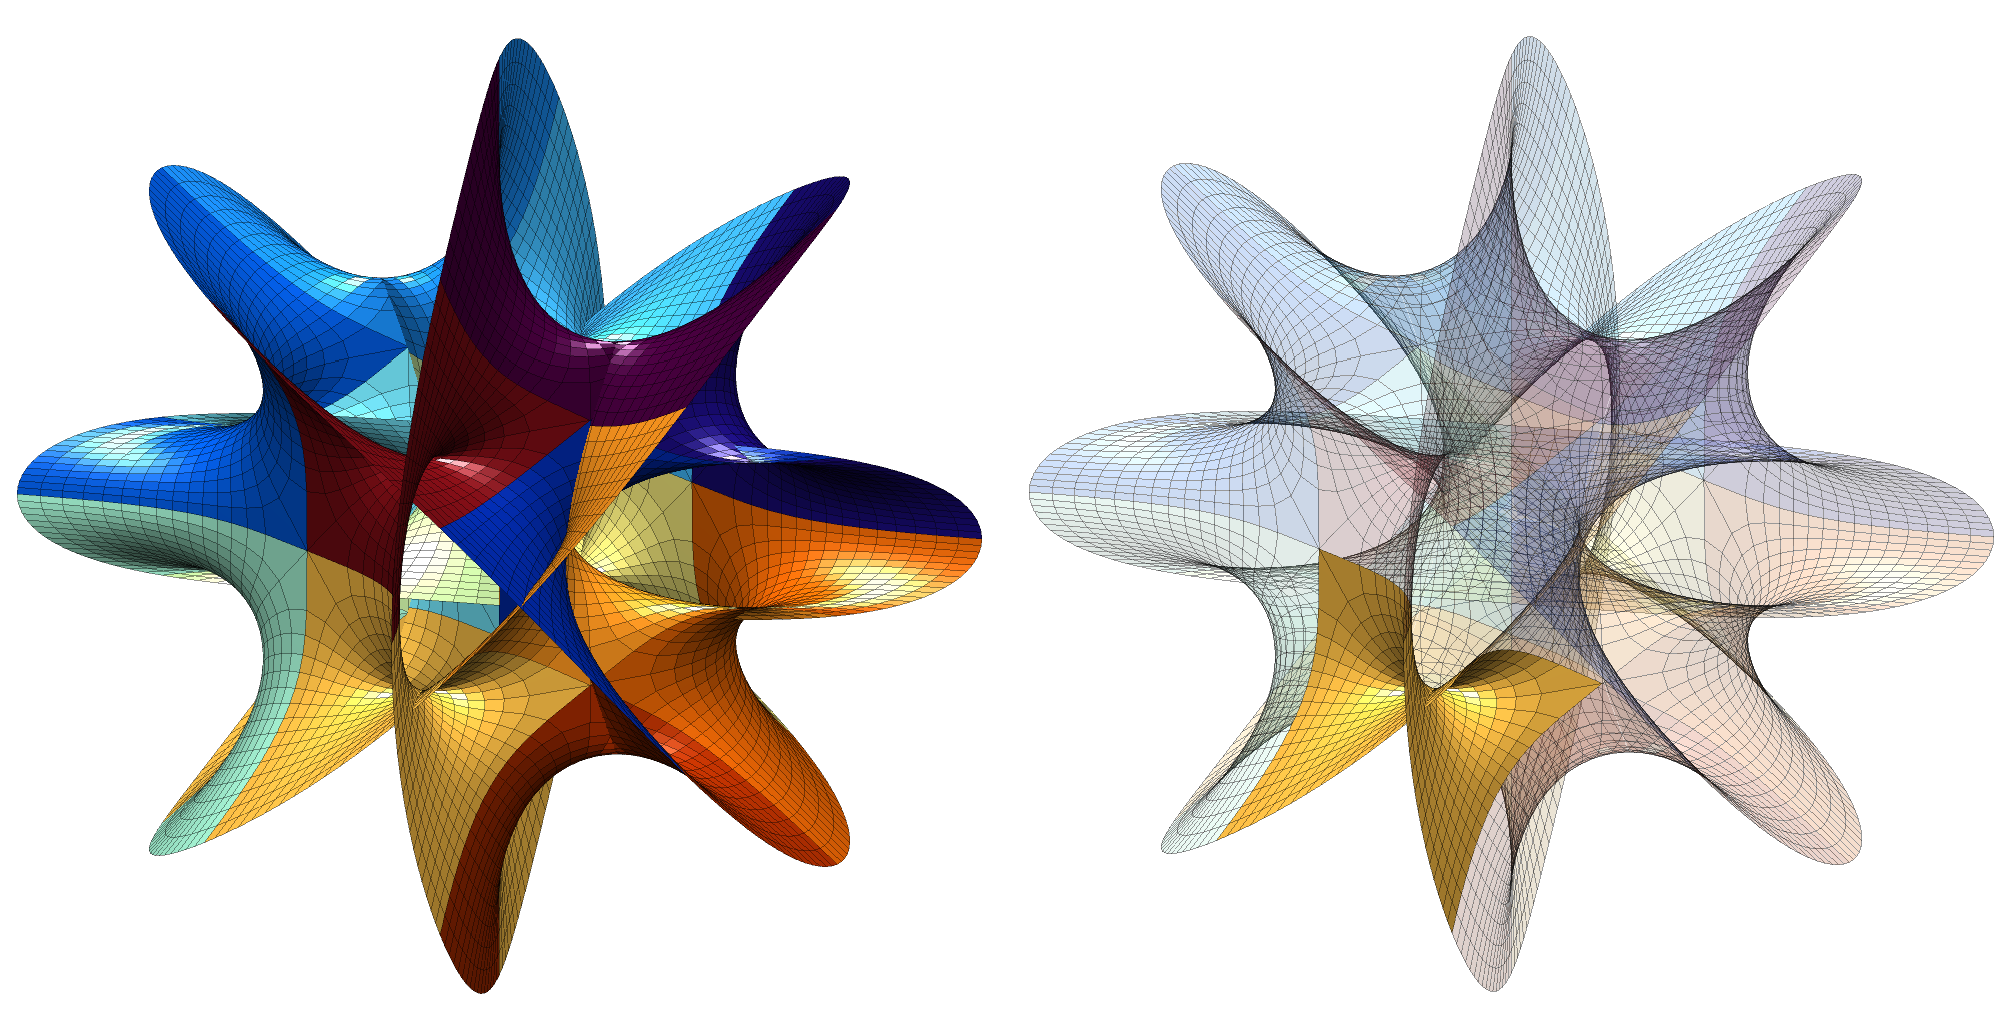
The boundary of the patches meet other patches except along two open borders (corresponding to large or small values of ): these form the edges of the manifold and strictly speaking I ought to have rendered them to infinity. That would have made it unbounded and somewhat boring to look at: four disks meeting at an angle, with the interesting part hidden inside. By marking the edges we can see that the boundary are four linked wobbly circles:
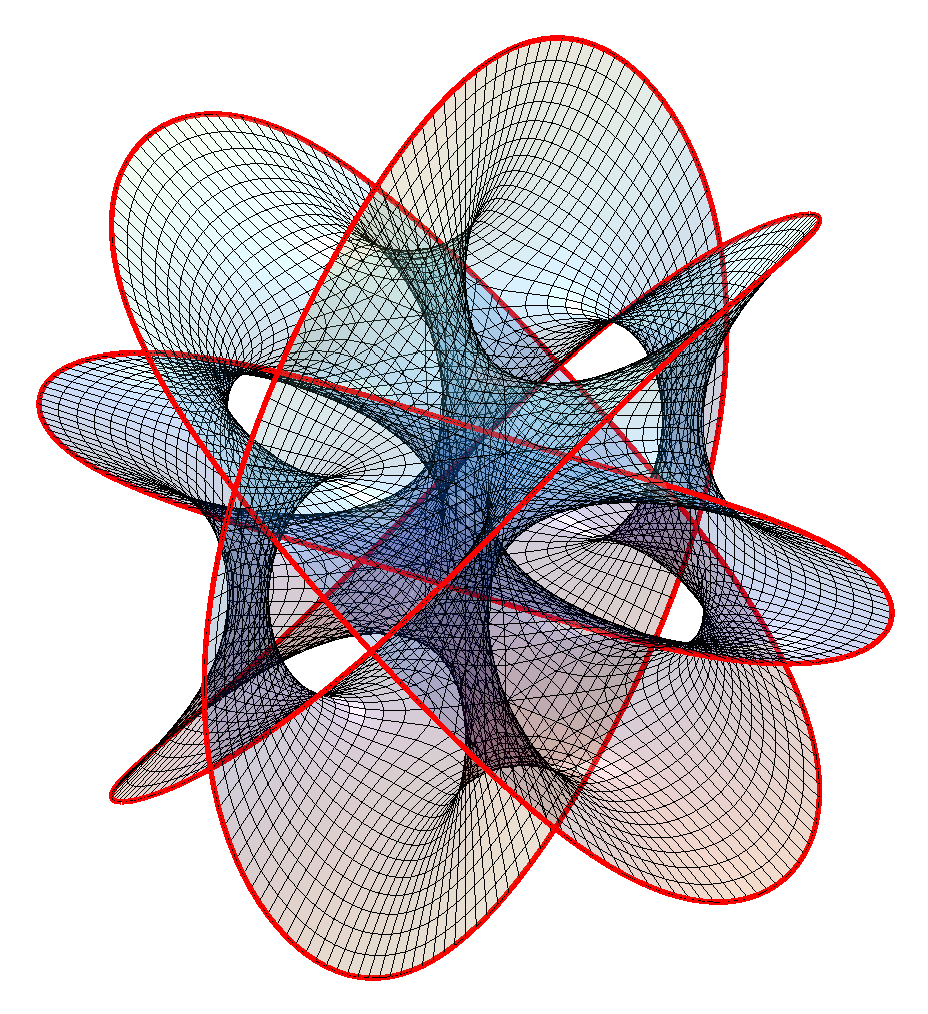
A surface bounded by a knot or a link is called a Seifert surface. While these surfaces look a lot like minimal surfaces they are not exactly minimal when I estimate the mean curvature (it should be exactly zero); while this could be because of lack of numerical precision I think it is real: while minimal surfaces are Ricci-flat, the converse is not necessarily true.
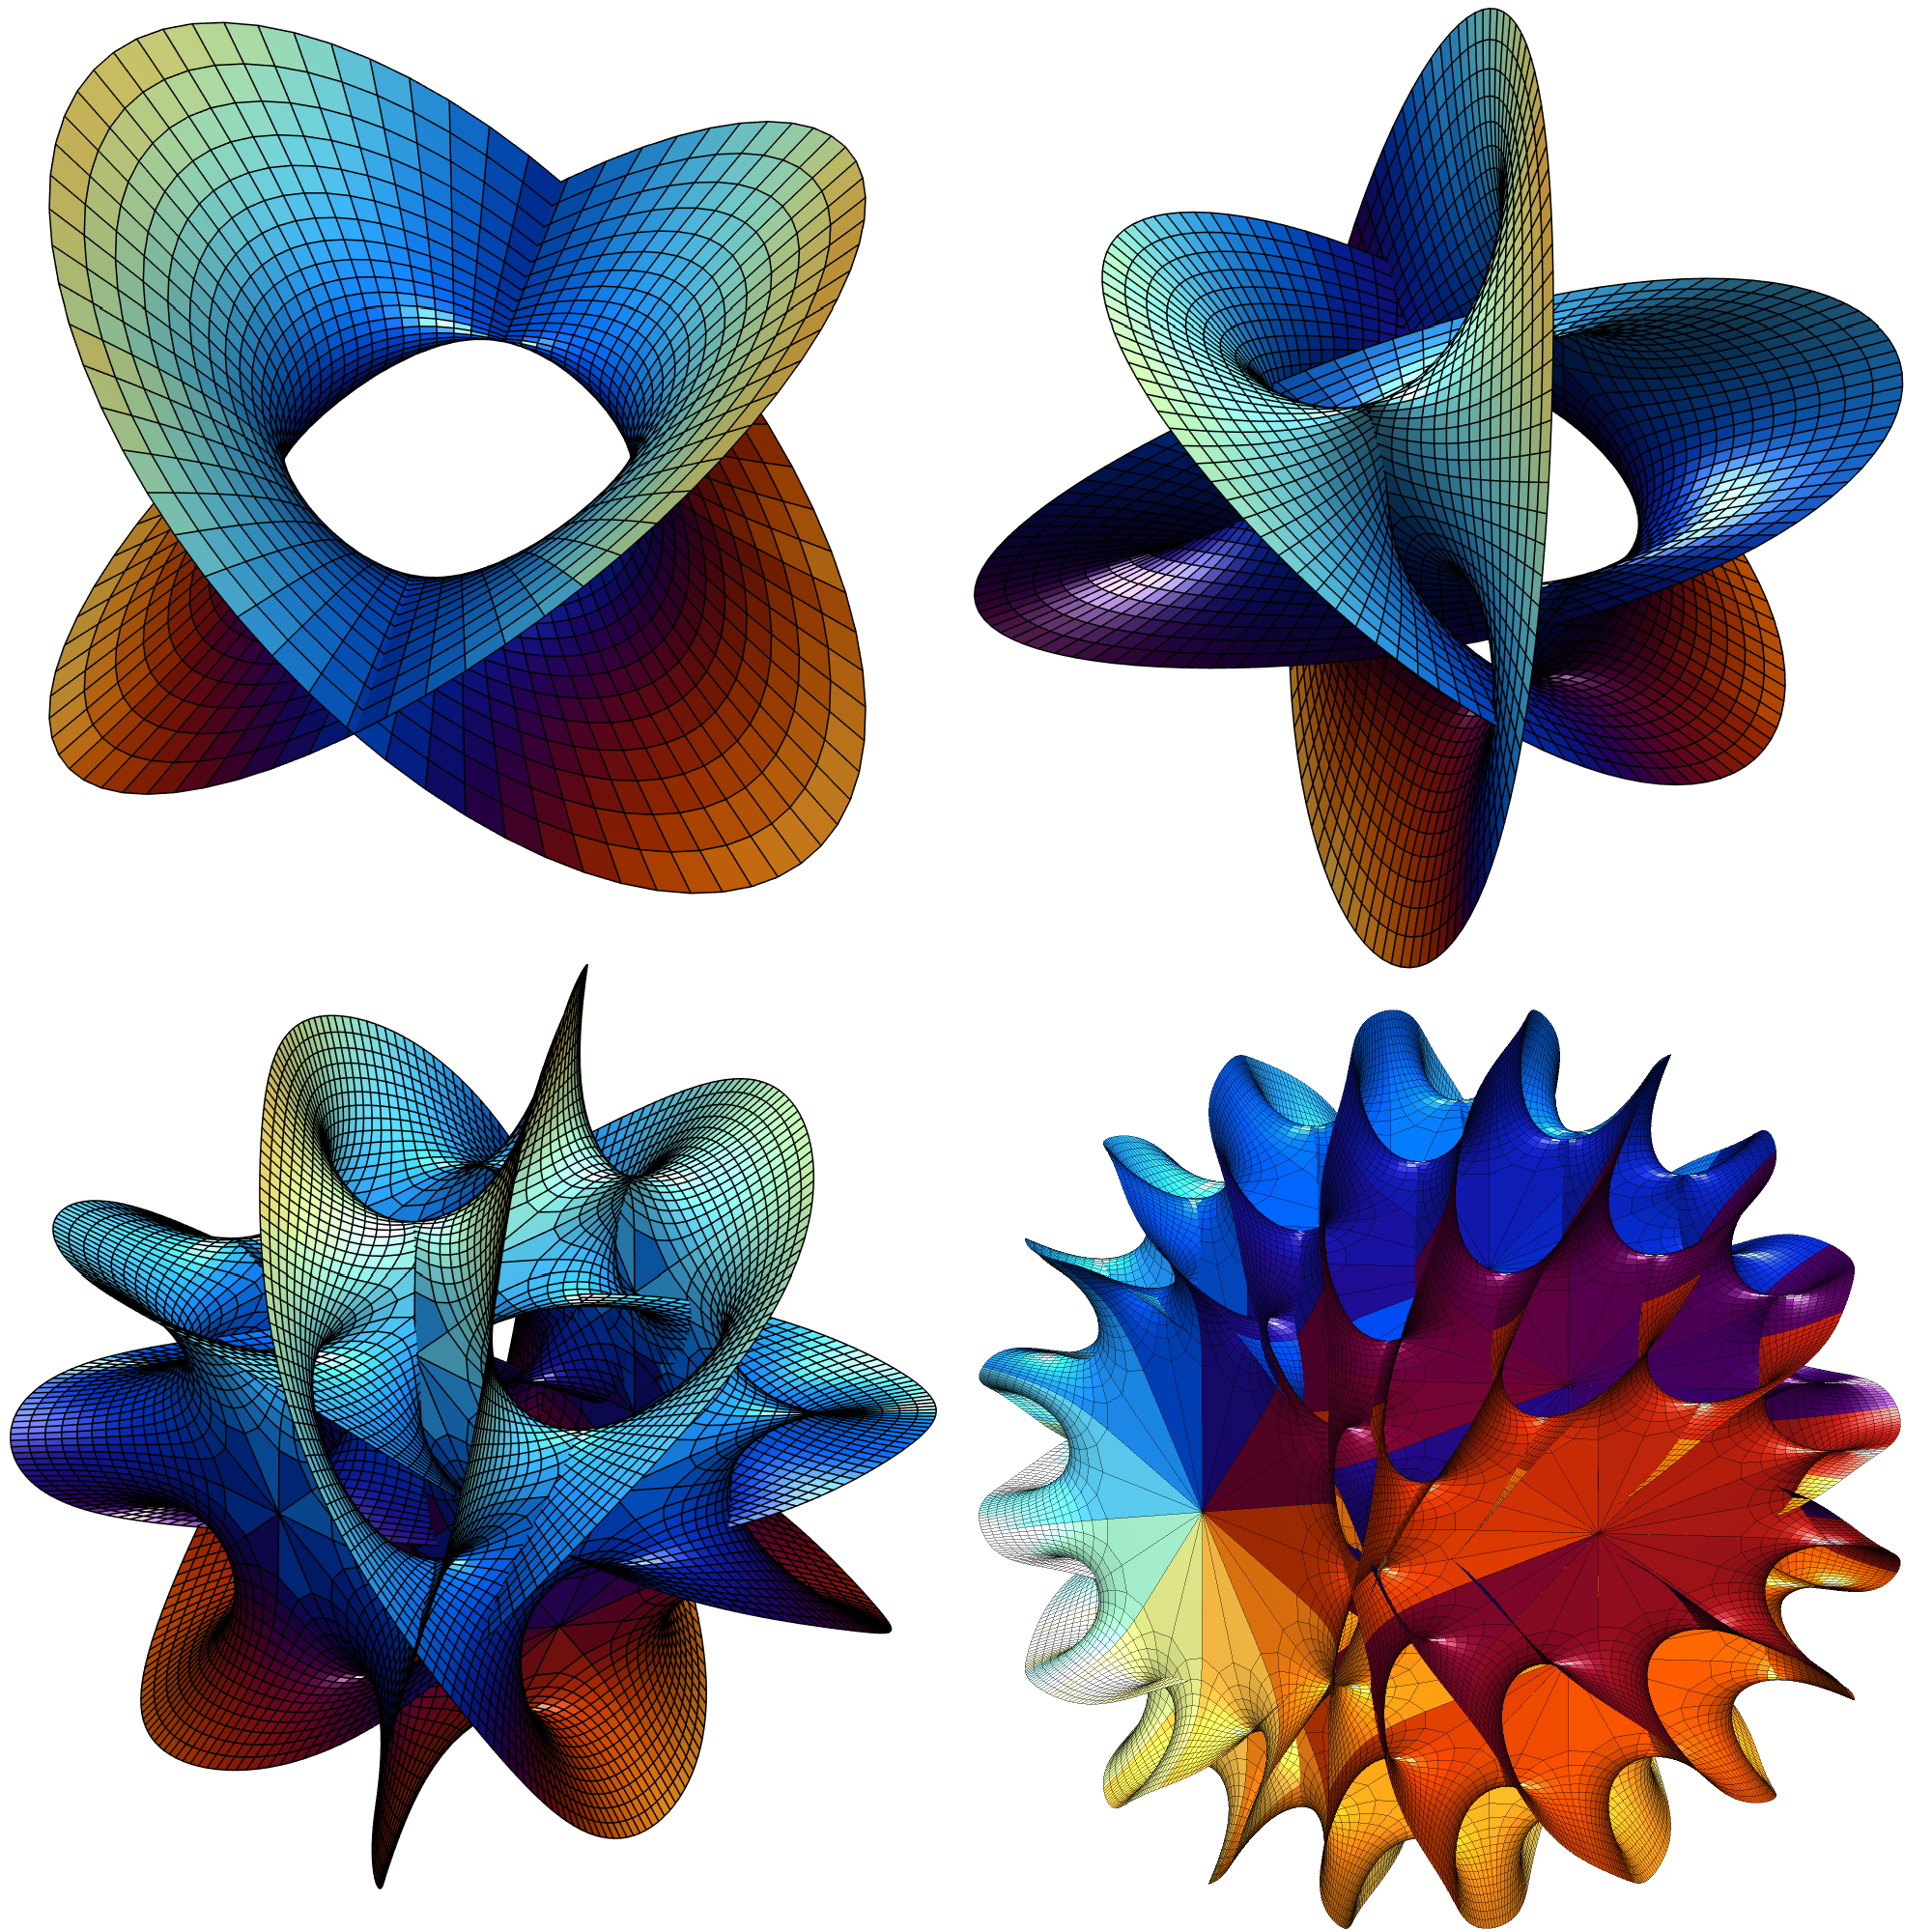
Changing N produces other surfaces. N=2 is basically a catenoid (tilted and self-intersecting). As N increases it becomes more like a barrel or a pufferfish, with one direction dominated by circular saddle regions, one showing a meshwork of spaces reminiscent of spacefilling minimal surfaces, and one a lot of overlapping “barbs”.
Note that just like for minimal surfaces one can multiply by
to get another surface in an associate family. In this case it circulates the patches along their circles without changing the surface much.
Hanson also notes that by changing the formula to we can get boundaries that are torus-knot-like. This leads to the formulae:
Appendix: Matlab code
%% Initialization

edge=0; % Mark edge?

coloring=1; % Patch coloring type

n=4;

s=0.1; % Gridsize

alp=1; ca=cos(alp); sa=sin(alp); % Projection

[theta,xi]=meshgrid(-1.5:s:1.5,1*(pi/2)*(0:1:16)/16);

z=theta+xi*i;

% Color scheme

tt=2*pi*(1:200)'/200; co=.5+.5*[cos(tt) cos(tt+1) cos(tt+2)];

colormap(co)

%% Plot

clf

hold on

for k1=0:(n-1)

for k2=0:(n-1)

z1=exp(k1*2*pi*i/n)*cosh(z).^(2/n);

z2=exp(k2*2*pi*i/n)*(1/i)*sinh(z).^(2/n);

X=real(z1);

Y=real(z2);

Z=ca*imag(z1)+sa*imag(z2);

if (coloring==0)

surf(X,Y,Z);

else

switch (coloring)

case 1

C=z1*0+(k1+k2*n); % Color by patch

case 2

C=abs(z1);

case 3

C=theta;

case 4

C=xi;

case 5

C=angle(z1);

case 6

C=z1*0+1;

end

h=surf(X,Y,Z,C);

set(h,'EdgeAlpha',0.4)

end

if (edge>0)

plot3(X(:,end),Y(:,end),Z(:,end),'r','LineWidth',2)

plot3(X(:,1),Y(:,1),Z(:,1),'r','LineWidth',2)

end

end

end

view([2 3 1])

camlight

h=camlight('left');

set(h,'Color',[1 1 1]*.5)

axis equal

axis vis3d

axis off
One thought on “Calabi-Yau and Hanson’s surfaces”