Tempus fugit
If I have one piece of advice to give to people, it is that they typically have way more time now than they will ever have in the future. Do not procrastinate, take chances when you see them – you might never have the time to do it later.
One reason is the gradual speeding up of subjective time as we age: one day is less time for a 40 year old than for a 20 year old, and way less than the eon it is to a 5 year old. Another is that there is a finite risk that opportunities will go away (including our own finite lifespans). The main reason is of course the planning fallacy: since we underestimate how long our tasks will take, our lives tend to crowd up. Accepting to give a paper in several months time is easy, since there seems to be a lot of time to do it in between… which mysteriously disappears until you sit there doing an all-nighter. There is also the likely effect that as you grow in skill, reputation and career there will be more demands on your time. All in all, expect your time to grow in preciousness!
Mining my calendar
I recently noted that my calendar had filled up several weeks in advance, something I think did not happen to this extent a few years back. A sign of a career taking off, worsening time management, or just bad memory? I decided to do some self-quantification using my Google calendar. I exported the calendar as an .ics file and made a simple parser in Matlab.

It is pretty clear from a scatter plot that most entries are for the near future – a few days or weeks ahead. Looking at a histogram shows that most are within a month (a few are in the past – I sometimes use my calendar to note when I have done something like an interview that I may want to remember later).
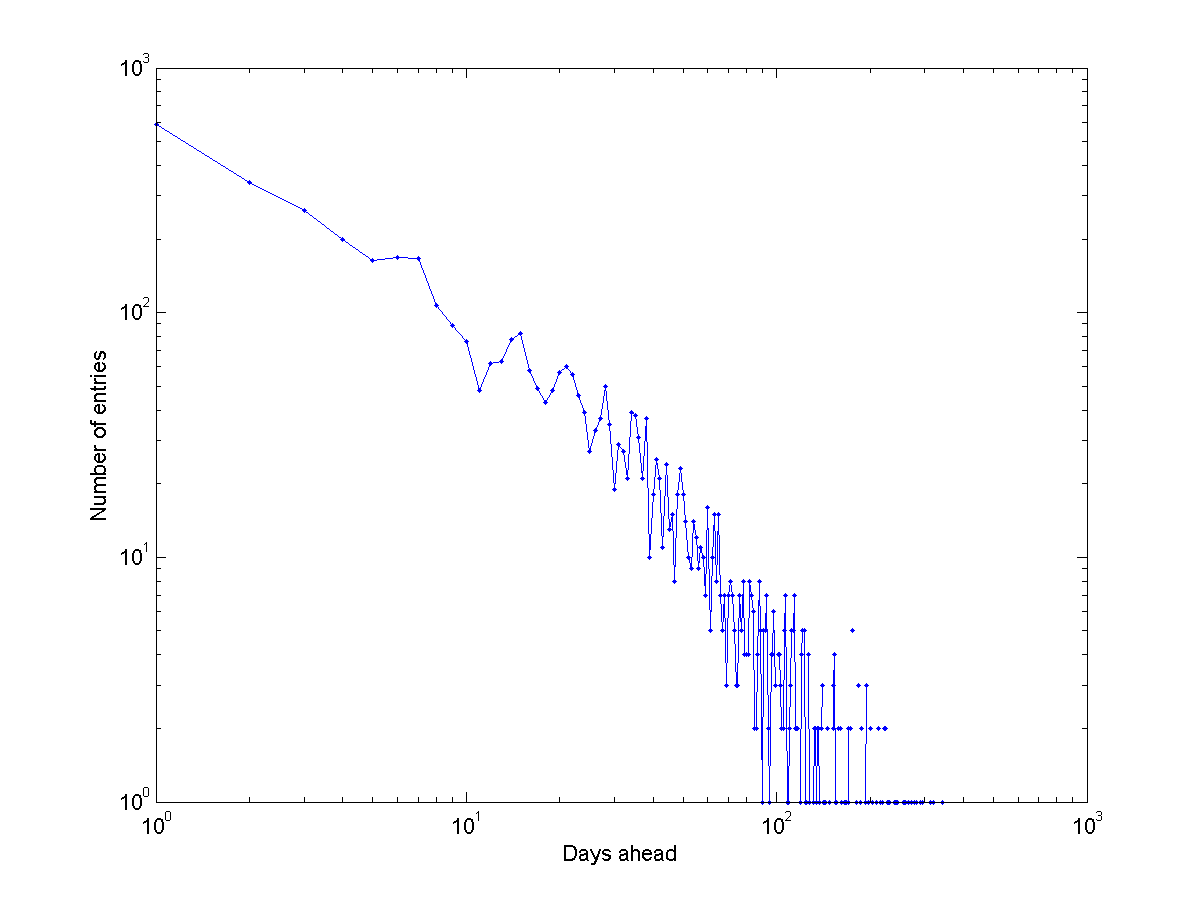
Plotting it as a log-log diagram suggests it is lighter-tailed than a power-law: there is a characteristic scale. And there are a few wobbles suggesting 1-week, 2-week and 3-week periodicities.
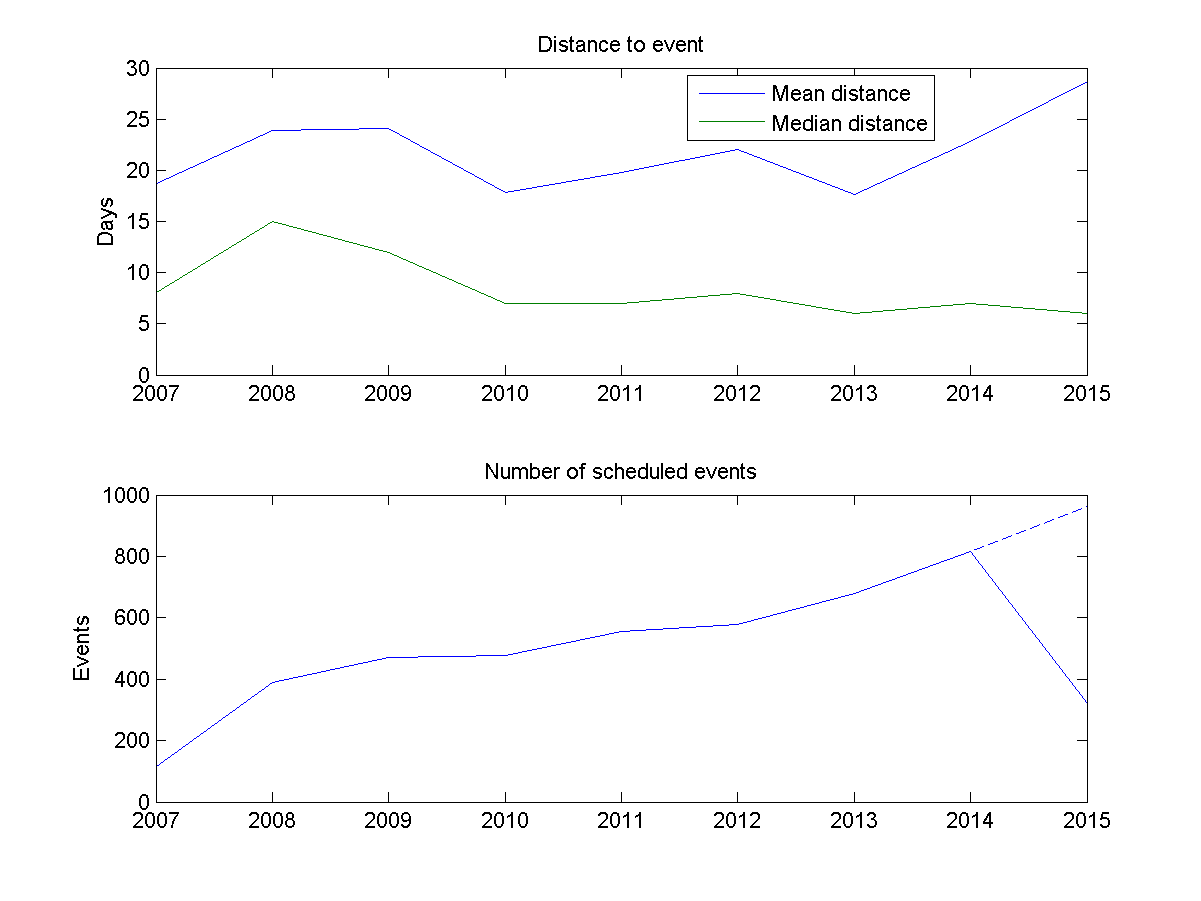
Am I getting busier? Plotting the mean and median distance to scheduled events, and the number of events per year, suggests yes. The median distance to the things I schedule seems to be creeping downwards, while the number of events per year has clearly doubled from about 400 in 2008 to 800 in 2014 (and extrapolating 2015 suggests about 1000 scheduled events).

Plotting the number of events I had per 14-day period also suggests that I have way more going on now than a few years ago. The peaks are getting higher and the mean period is more intense.
When am I free?
A good measure of busyness would be the time horizon: how far ahead should you ask me for a meeting if you want to have a high chance of getting it?
One approach would be to look for the probability ")


")
 = \prod_{i=t}^\infty (1-P(i))")
=N(i)/N")
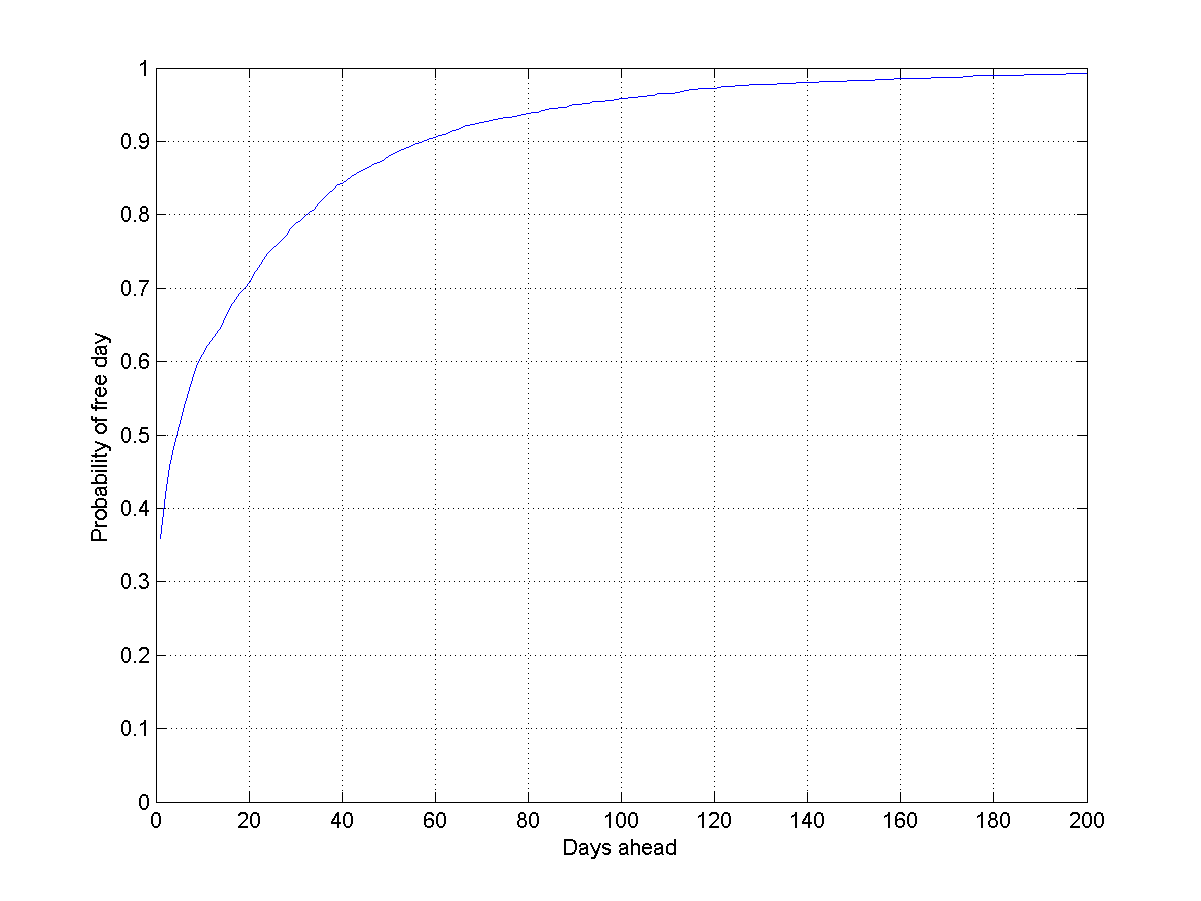
However, this method is slightly wrong. Some days are free, others have many different events. If I schedule twice as many events the chance of a free day should be lower. A better way of estimating ")
=N(i)/T")

 = \prod_{i=t}^\infty e^{-\lambda(i)}")
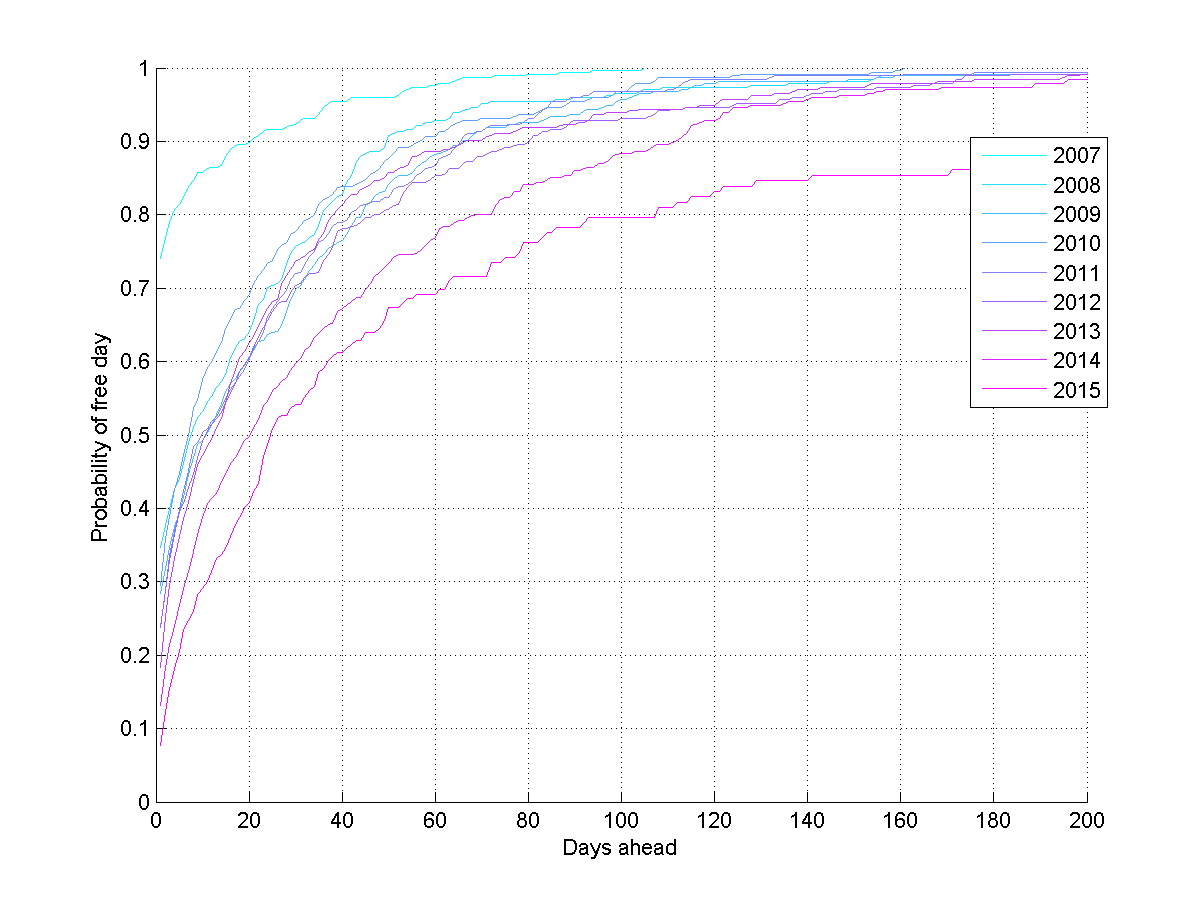
If we slice the data by year, then there seems to be a fairly clear trend towards the planning horizon growing – I have more and more events far into future, and I have more to do. Oh, those halcyon days in 2007 when I presumably just lazed around…
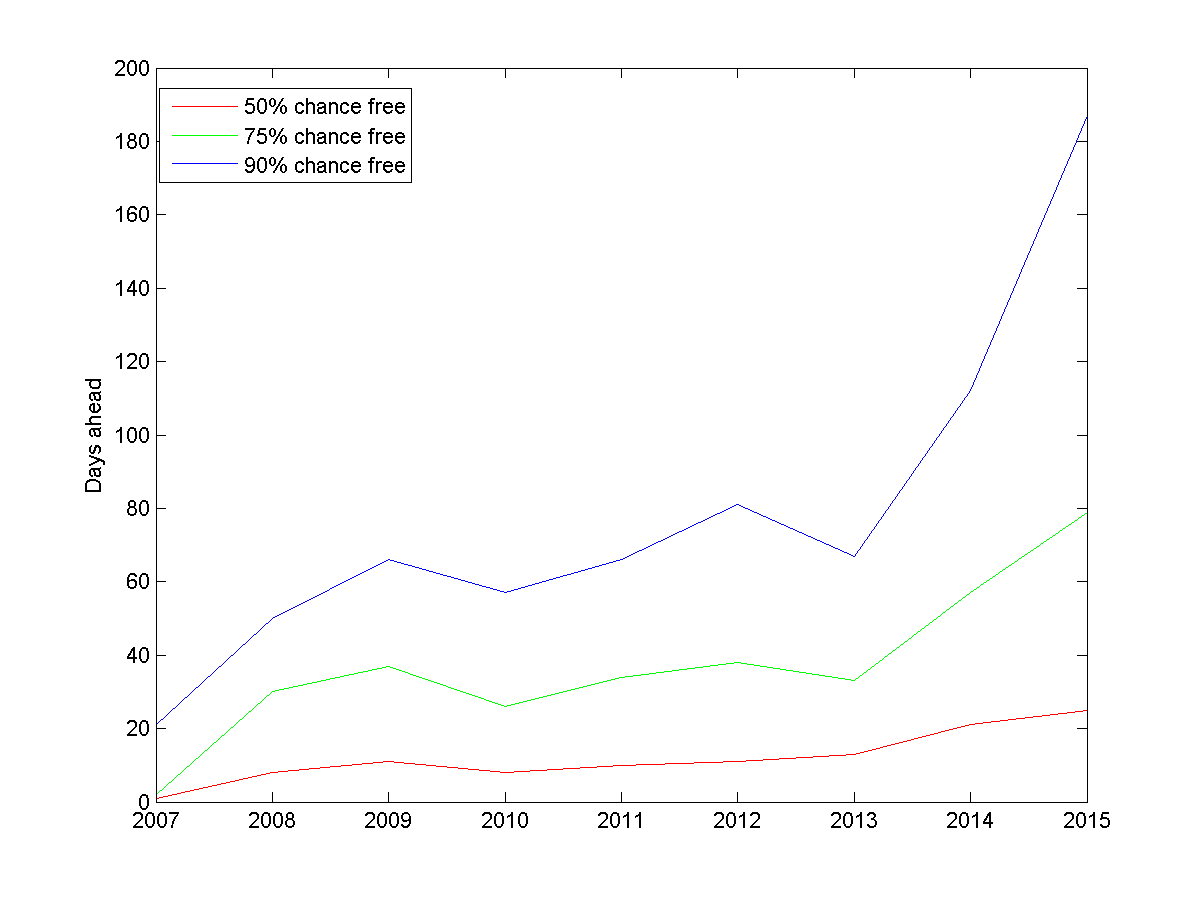
If we plot when I have 50%, 75% and 90% chance of being free, the trend is even clearer. At present you need to ask about three weeks in advance to have a 50% chance of grabbing me, and 187 days in advance to be 90% certain (if you want an entire working week with 50% chance, this is close to where you should go). Back in 2008 the 50% point was about a week and the 90% point 1.5 months ahead. I have become around 3 times busier.
Conclusions
So, I have become busier. This is of course no evidence of getting more done – a lot of events are pointless meetings, and who knows if I am doing anything helpful at the other events. Plus, I might actually be wasting my time doing statistics and blogging instead of working.
But the exercise shows that it is possible to automatically estimate necessary planning horizons. Maybe we should add this to calendar apps to help scheduling: my contact page or virtual secretary might give you an automatically updated estimate of how far ahead you need to schedule things to have a good chance of getting me. It doesn’t have to tell you my detailed schedule (in principle one could do a privacy attack on the schedule by asking for very specific dates and seeing if they were blocked).
We can also use this method to look at levels of busyness across organisations. Who have flexibility in their schedules, who are so overloaded that they cannot be effectively involved in projects? In the past, tasks tended to be simple and the issue was just the amount of time people had. But today we work individually yet as part of teams, and coordination (meetings, seminars, lectures) are the key links: figuring out how to schedule them right is important for effectivity.
If team member 
")
=\prod_{i=t}^\infty e^{-\sum_j\lambda_j(i)}")
In the end, I prefer to live by the advice my German teacher Ulla Landvik once gave me, glancing at the school clock: “I see we have 30 seconds left of the lesson. Let’s do this excercise – we have plenty of time!” Time not only flies, it can be stretched too.
Addendum 2015-05-01
Some further explorations.

Owen Cotton-Barratt pointed out that another measure of busyness might be the distance to the next free day. Plotting it shows a very bursty pattern, with noisy peaks. The mean time was about 2-3 days: even though a lot of time the horizon is far away, often an empty day slips through too. It is just that it cannot be relied on.

Are there periodicities? The most obvious is the weekly dynamics: Thursdays are busiest, weekend least busy. I tend to do scheduling in a roughly similar manner, with Tuesdays as the top scheduling day.
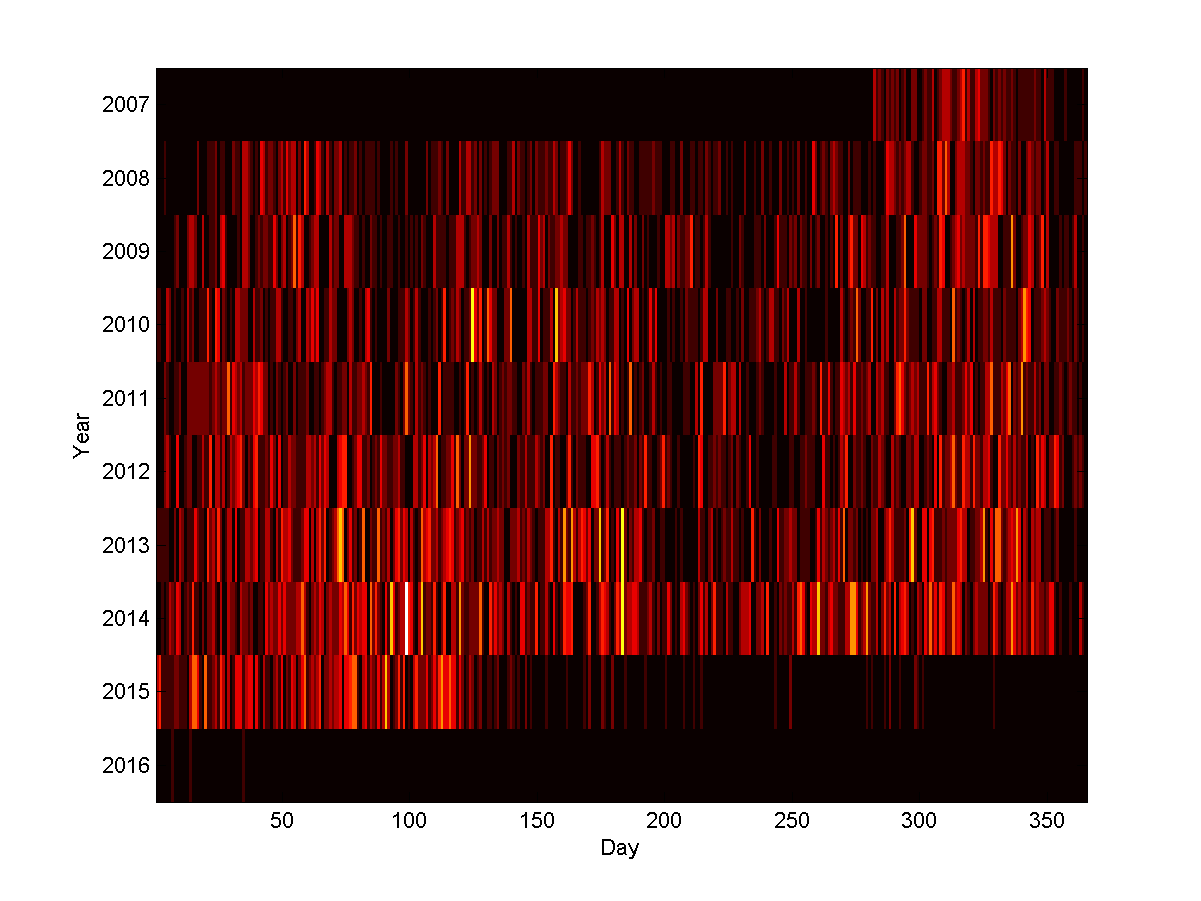
Over the years, plotting the number of events per day (“event intensity”) it is also clear that there is a loose pattern. Back in 2008-2011 one can see a lower rate around day 75 – that is the break between Hilary and Trinity term here in Oxford. There is another trough around day 200-250, the summer break and the time before the Michaelmas term. However, this is getting filled up over time.
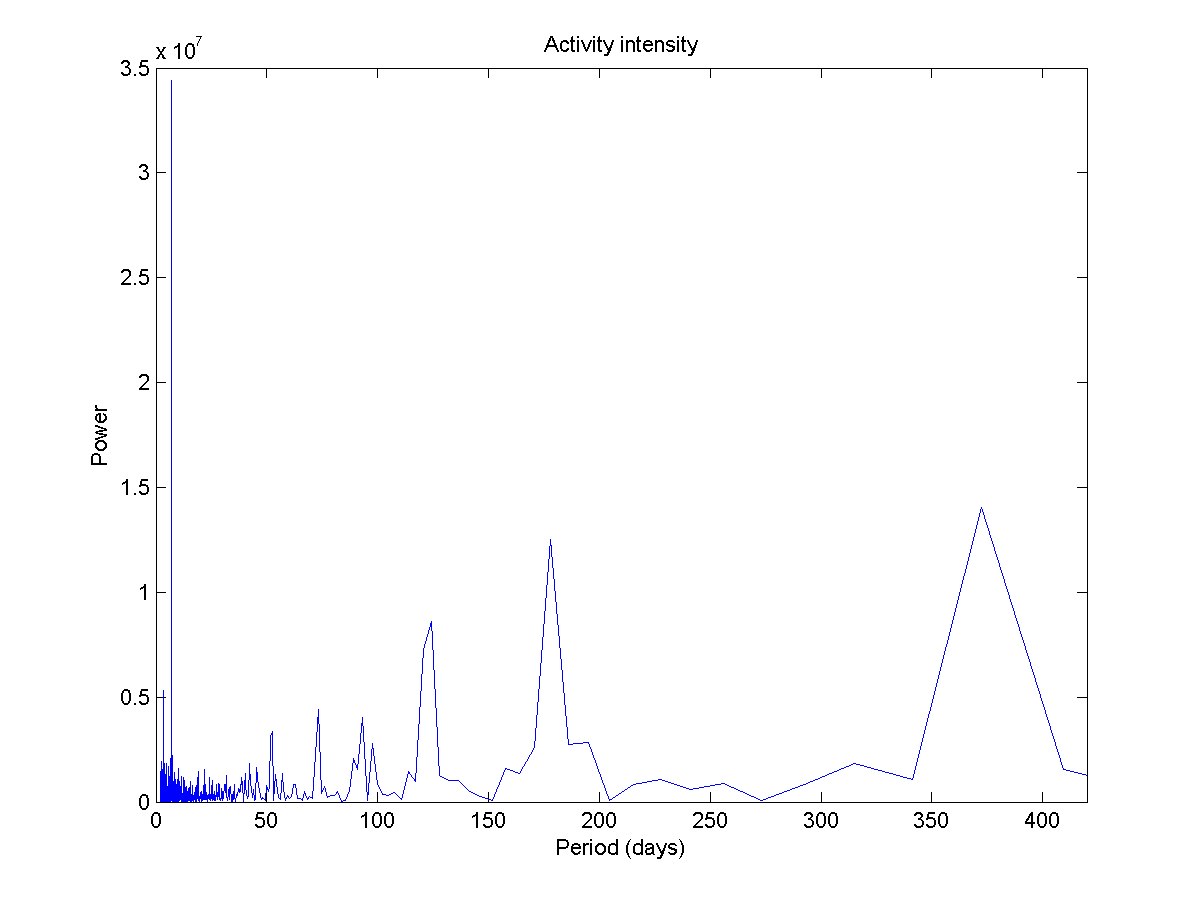
Making a periodogram produces an obvious peak for 7 days, and a loose yearly periodicity. Between them there is a bunch of harmonics. The funny thing is that the week periodicity is very strong but hard to see in the map above.