I recently nerded out about high-energy proton interaction with matter, enjoying reading up on the Bethe equation at the Particle Data Group review and elsewhere. That got me to look around at the PDL website, which is full of awesome stuff – everything from math and physics reviews to data for the most obscure “particles” ever, plus tests of how conserved the conservation laws are.
That binge led me to this interesting set of historical graphs of the estimates of various physical constants in the PDG publications over time:
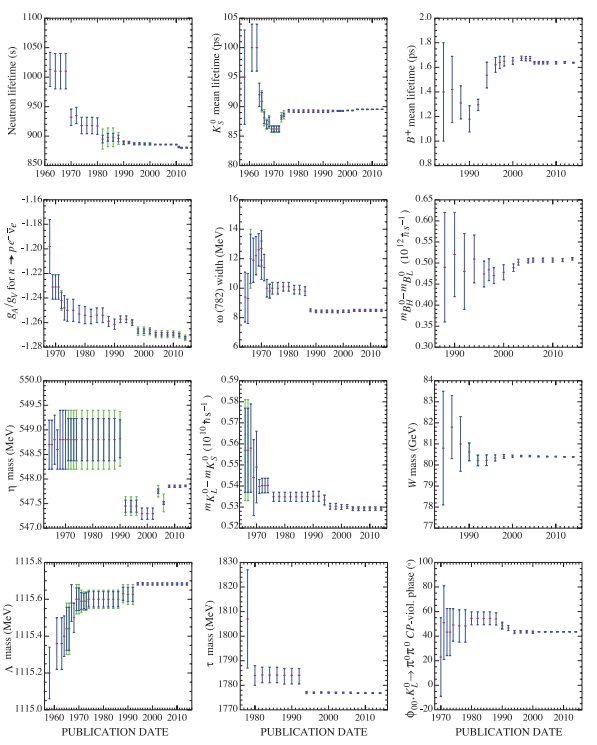
The first thing that strikes the viewer is that they have moved a fair bit, including often being far outside the original error bars. 6 of them have escaped them. That doesn’t look very good for science!
Fortunately, it turns out that these error bars are not 95% confidence intervals (the most common form in many branches of science) but 68.3% confidence intervals (one standard deviation, if things are normal). That means having half of them out of range is entirely reasonable! On the other hand, most researchers don’t understand error bars (original paper), and we should be able to do much better.
The PDG state:
Sometimes large changes occur. These usually reflect the introduction of significant new data or the discarding of older data. Older data are discarded in favor of newer data when it is felt that the newer data have smaller systematic errors, or have more checks on systematic errors, or have made corrections unknown at the time of the older experiments, or simply have much smaller errors. Sometimes, the scale factor becomes large near the time at which a large jump takes place, reflecting the uncertainty introduced by the new and inconsistent data. By and large, however, a full scan of our history plots shows a dull progression toward greater precision at central values quite consistent with the first data points shown.
Overall, kudos to PDG for showing the history and making it clearer what is going on! But I do not agree it is a dull progression.
Zigzag to truth
The locus classicus for histories of physical constants being not quite a monotonic march towards truth is Max Henrion and Baruch Fischhoff. Assessing uncertainty in physical constants. American Journal of Physics 54, 791 (1986); doi: 10.1119/1.14447. They discuss the problem of people being overconfident and badly calibrated, and then show the zigzagging approach to current values:
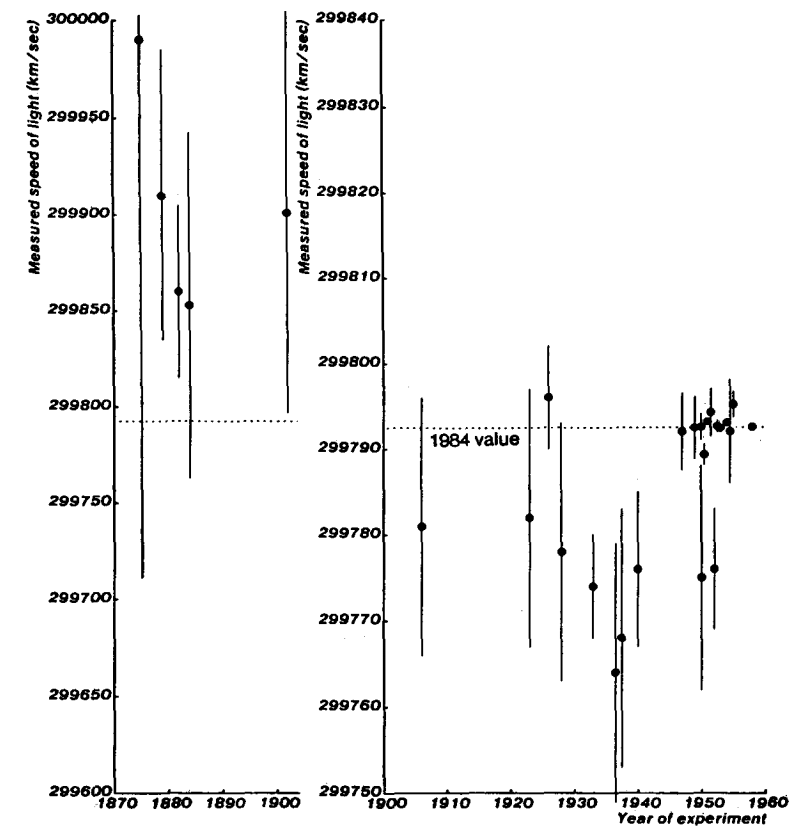
Note that the shifts were far larger than the estimated error bars. The dip in the 1930s and 40s even made some physicists propose that c could be changing over time. Overall Henrion and Fischhoff find that physicists have been rather overconfident in their tight error bounds on their measurements. The approach towards current estimates is anything but dull, and hides many amusing historical anecdotes.
Stories like this might have been helpful; it is notable that the PDG histories on the right, for newer constants, seem to stay closer to the present value than the longer ones to the left. Maybe this is just because they have not had the time to veer off yet, but one can be hopeful.
Still, even if people are improving this might not mean the conclusions stay stable or approach truth monotonically. A related issue is “negative learning”, where more data and improved models make the consensus view of a topic move in the wrong direction: Oppenheimer, M., O’Neill, B. C., & Webster, M. (2008). Negative learning. Climatic Change, 89(1-2), 155-172. Here the problem is not just that people are overconfident in how certain they can be about their conclusions, but also that there is a bit of group-think, plus that the models change in structure and are affected in different ways by the same data. They point out how estimates of ozone depletion oscillated, or the consensus on the stability of climate has shifted from oscillatory (before 1968) towards instability (68-82), towards stability (82-96), and now towards instability again (96-06). These problems are not due to mere irrationality, but the fact that as we learn more and build better models these incomplete but better models may still deviate strongly from the ground truth because they miss some key component.
Noli fumare
This is related to what Nick Bostrom calls the “data fumes” problem. Early data will be fragmentary and explanations uncertain – but the data points and their patterns are very salient, just as the early models, since there is nothing else. So we begin to anchor on them. Then new data arrives and the models improve… and the old patterns are revealed as statistical noise, or bugs in the simulation or plotting routine. But since we anchored on them, we are unlikely to update as strongly towards the new most likely estimates. Worse, accommodating a new model takes mental work; our status quo bias will be pushing against the update. Even if we do accommodate the new state, things will likely change more – we may well end up either with a view anchored on early noise, or assume that the final state is far more uncertain than it actually is (since we weigh the early jumps strongly because of their saliency).
This is of course why most people prefer to believe a charismatic diet cultleader expert rather than trying to dig through 70 years of messy, conflicting dietary epidemiology.
Here is a simple example where an agent is trying to do a maximum likelihood estimation of a Gaussian distribution with mean 1 and variance 1, but is hamstrung by giving double weight to the first 9 data points:
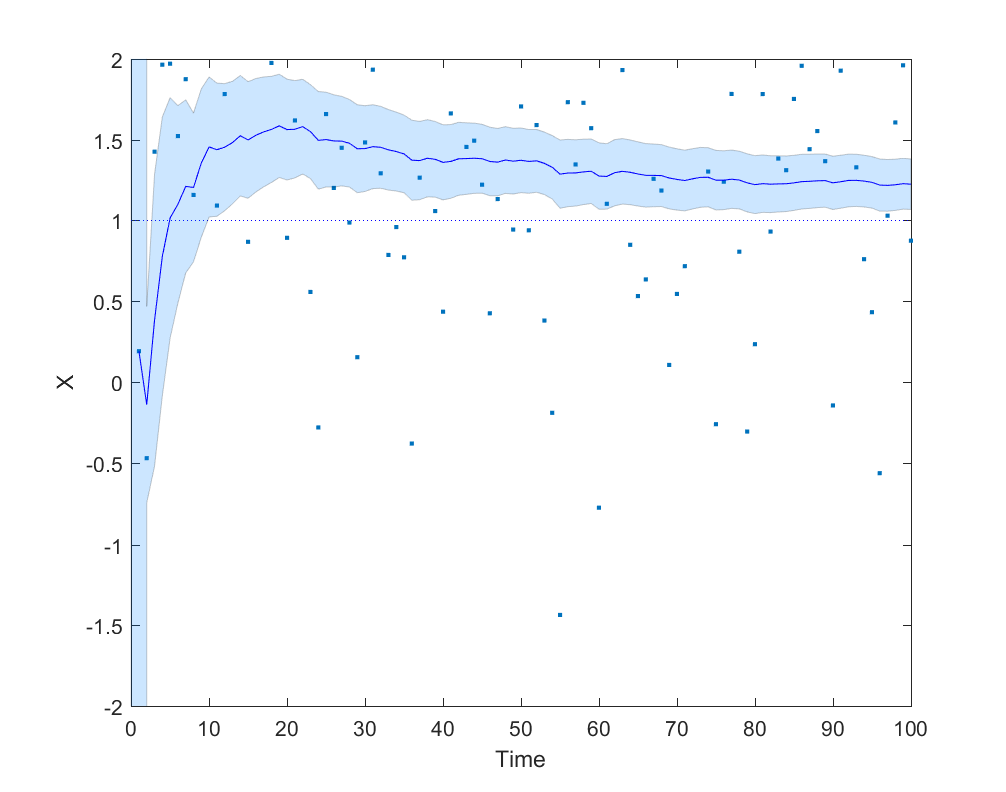
It is not hard to complicate the model with anchoring/recency/status quo bias (estimates get biased towards previous estimates), or that early data points are more polluted by differently distributed noise. Asymmetric error checking (you will look for bugs if results deviate from expectation and hence often find such bugs, but not look for bugs making your results closer to expectation) is another obvious factor for how data fumes can get integrated in models.
The problem with data fumes is that it is not easy to tell when you have stabilized enough to start trusting the data. It is even messier when the inputs are results generated by your own models or code. I like to approach it by using multiple models to guesstimate model error: for example, one mathematical model on paper and one Monte Carlo simulation – if they don’t agree, then I should disregard either answer and keep on improving.
Even when everything seems to be fine there may be a big crucial consideration one has missed. The Turing-Good estimator gives another way of estimating the risk of that: if you have acquired 


/N \ll 1")