Robin Hanson mentions that some people take him to task for working on one scenario (WBE) that might not be the most likely future scenario (“standard AI”); he responds by noting that there are perhaps 100 times more people working on standard AI than WBE scenarios, yet the probability of AI is likely not a hundred times higher than WBE. He also notes that there is a tendency for thinkers to clump onto a few popular scenarios or issues. However:
In addition, due to diminishing returns, intellectual attention to future scenarios should probably be spread out more evenly than are probabilities. The first efforts to study each scenario can pick the low hanging fruit to make faster progress. In contrast, after many have worked on a scenario for a while there is less value to be gained from the next marginal effort on that scenario.
This is very similar to my own thinking about research effort. Should we focus on things that are likely to pan out, or explore a lot of possibilities just in case one of the less obvious cases happens? Given that early progress is quick and easy, we can often get a noticeable fraction of whatever utility the topic has by just a quick dip. The effective altruist heuristic of looking at neglected fields also is based on this intuition.
A model
But under what conditions does this actually work? Here is a simple model:
There are possible scenarios, one of which () will come about. They have probability . We allocate a unit budget of effort to the scenarios: . For the scenario that comes about, we get utility (diminishing returns).
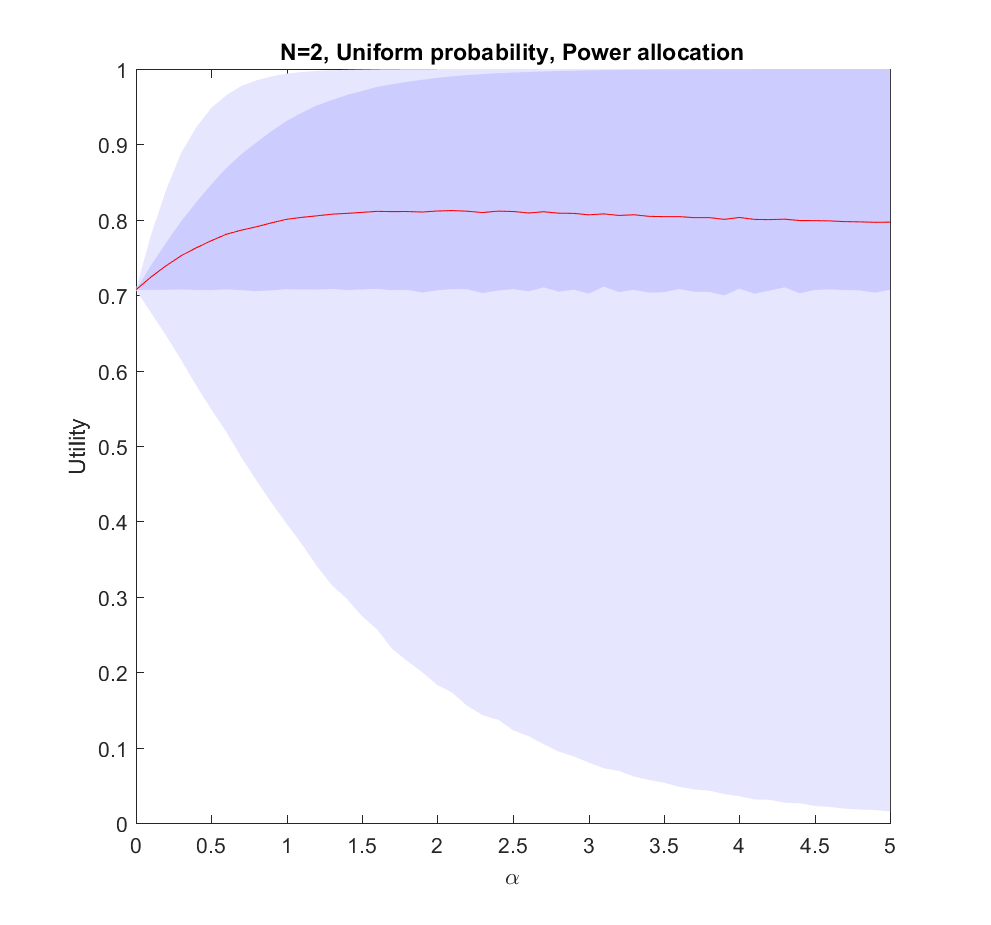
Here is what happens if we allocate proportional to a power of the scenarios, . corresponds to even allocation, 1 proportional to the likelihood, >1 to favoring the most likely scenarios. In the following I will run Monte Carlo simulations where the probabilities are randomly generated each instantiation. The outer bluish envelope represents the 95% of the outcomes, the inner ranges from the lower to the upper quartile of the utility gained, and the red line is the expected utility.
Utility of allocating effort as a power of the probability of scenarios. Red line is expected utility, deeper blue envelope is lower and upper quartiles, lighter blue 95% interval.
This is the case: we have two possible scenarios with probability and (where is uniformly distributed in [0,1]). Just allocating evenly gives us utility on average, but if we put in more effort on the more likely case we will get up to 0.8 utility. As we focus more and more on the likely case there is a corresponding increase in variance, since we may guess wrong and lose out. But 75% of the time we will do better than if we just allocated evenly. Still, allocating nearly everything to the most likely case means that one does lose out on a bit of hedging, so the expected utility declines slowly for large .
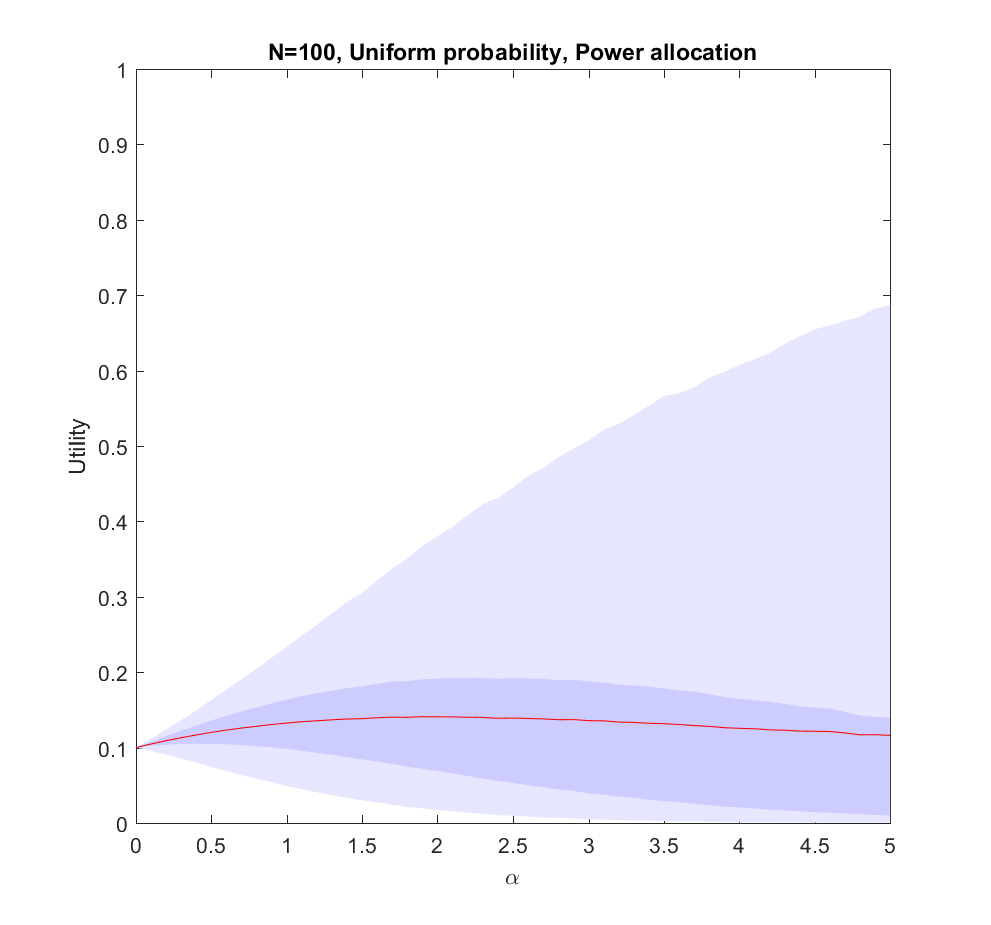
Utility of allocating effort as a power of the probability of scenarios. Red line is expected utility, deeper blue envelope is lower and upper quartiles, lighter blue 95% interval. 100 possible scenarios, with uniform probability on the simplex.
The case (where the probabilities are allocated based on a flat Dirichlet distribution) behaves similarly, but the expected utility is smaller since it is less likely that we will hit the right scenario.
What is going on?
This doesn’t seem to fit Robin’s or my intuitions at all! The best we can say about uniform allocation is that it doesn’t produce much regret: whatever happens, we will have made some allocation to the possibility. For large N this actually works out better than the directed allocation for a sizable fraction of realizations, but on average we get less utility than betting on the likely choices.
The problem with the model is of course that we actually know the probabilities before making the allocation. In reality, we do not know the likelihood of AI, WBE or alien invasions. We have some information, and we do have priors (like Robin’s view that ), but we are not able to allocate perfectly. A more plausible model would give us probability estimates instead of the actual probabilities.
We know nothing
Let us start by looking at the worst possible case: we do not know what the true probabilities are at all. We can draw estimates from the same distribution – it is just that they are uncorrelated with the true situation, so they are just noise.
Utility of allocating effort as a power of the probability of scenarios, but the probabilities are just random guesses. Red line is expected utility, deeper blue envelope is lower and upper quartiles, lighter blue 95% interval. 100 possible scenarios, with uniform probability on the simplex.
In this case uniform distribution of effort is optimal. Not only does it avoid regret, it has a higher expected utility than trying to focus on a few scenarios (). The larger N is, the less likely it is that we focus on the right scenario since we know nothing. The rationality of ignoring irrelevant information is pretty obvious.
Note that if we have to allocate a minimum effort to each investigated scenario we will be forced to effectively increase our above 0. The above result gives the somewhat optimistic conclusion that the loss of utility compared to an even spread is rather mild: in the uniform case we have a pretty low amount of effort allocated to the winning scenario, so the low chance of being right in the nonuniform case is being balanced by having a slightly higher effort allocation on the selected scenarios. For high there is a tail of rare big “wins” when we hit the right scenario that drags the expected utility upwards, even though in most realizations we bet on the wrong case. This is very much the hedgehog predictor story: ocasionally they have analysed the scenario that comes about in great detail and get intensely lauded, despite looking at the wrong things most of the time.
We know a bit
We can imagine that knowing more should allow us to gradually interpolate between the different results: the more you know, the more you should focus on the likely scenarios.
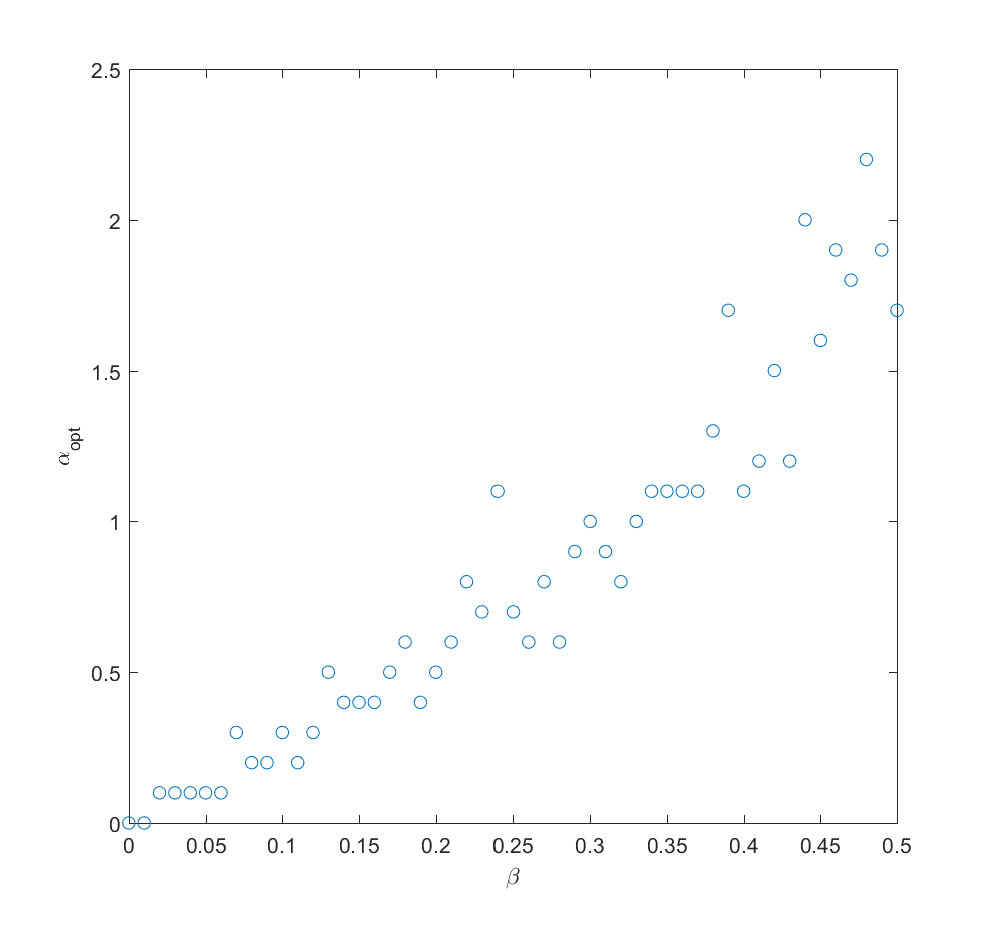
Optimal alpha as a function of how much information we have about the true probabilities (noise due to Monte Carlo and discrete steps of alpha). N=2 (N=100 looks similar).
If we take the mean of the true probabilities with some randomly drawn probabilities (the “half random” case) the curve looks quite similar to the case where we actually know the probabilities: we get a maximum for . In fact, we can mix in just a bit () of the true probability and get a fairly good guess where to allocate effort (i.e. we allocate effort as where is uncorrelated noise probabilities). The optimal alpha grows roughly linearly with , in this case.
We learn
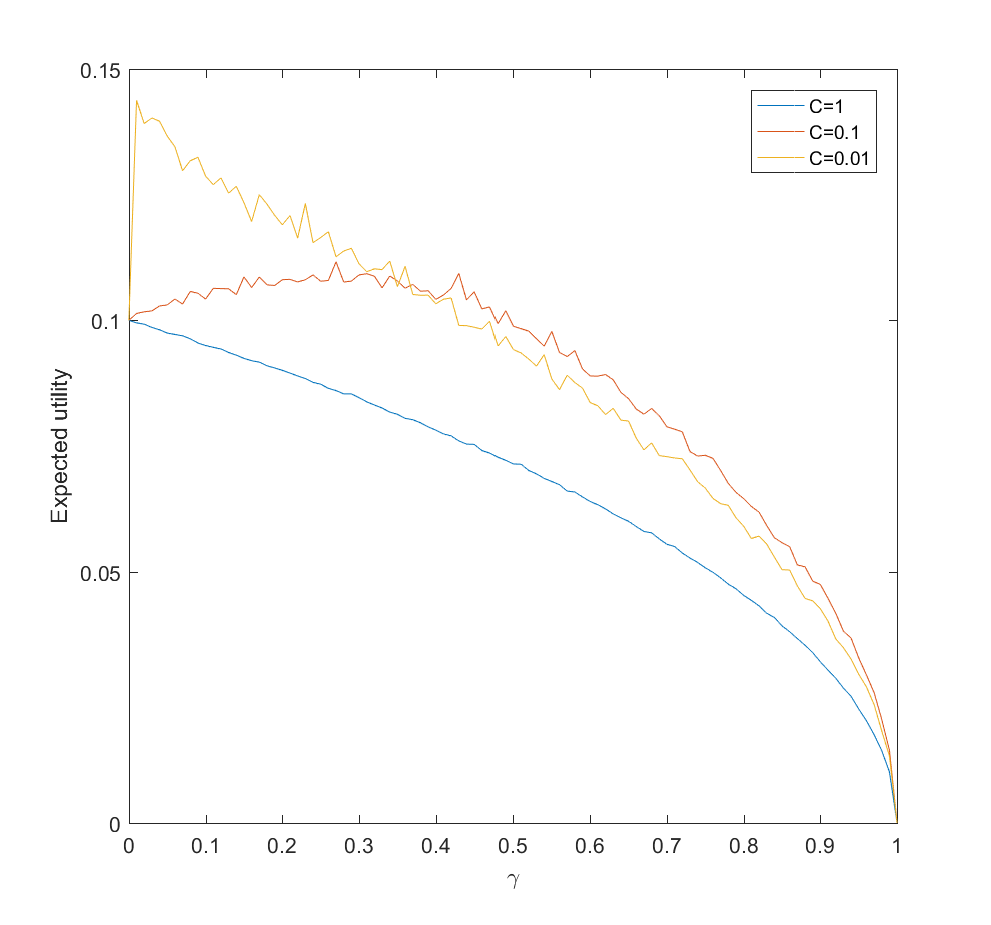
Adding a bit of realism, we can consider a learning process: after allocating some effort to the different scenarios we get better information about the probabilities, and can now reallocate. A simple model may be that the standard deviation of noise behaves as where is the effort placed in exploring the probability of scenario . So if we begin by allocating uniformly we will have noise at reallocation of the order of . We can set , where is some constant denoting how tough it is to get information. Putting this together with the above result we get . After this exploration, now we use the remaining effort to work on the actual scenarios.
Expected utility as a function of amount of probability-estimating effort (gamma) for C=1 (hard to update probabilities), C=0.1 and C=0.01 (easy to update). N=100.
This is surprisingly inefficient. The reason is that the expected utility declines as and the gain is just the utility difference between the uniform case and optimal , which we know is pretty small. If C is small (i.e. a small amount of effort is enough to figure out the scenario probabilities) there is an optimal nonzero . This optimum decreases as C becomes smaller. If C is large, then the best approach is just to spread efforts evenly.
Conclusions
So, how should we focus? These results suggest that the key issue is knowing how little we know compared to what can be known, and how much effort it would take to know significantly more.
If there is little more that can be discovered about what scenarios are likely, because our state of knowledge is pretty good, the world is very random, or improving knowledge about what will happen will be costly, then we should roll with it and distribute effort either among likely scenarios (when we know them) or spread efforts widely (when we are in ignorance).
If we can acquire significant information about the probabilities of scenarios, then we should do it – but not overdo it. If it is very easy to get information we need to just expend some modest effort and then use the rest to flesh out our scenarios. If it is doable but costly, then we may spend a fair bit of our budget on it. But if it is hard, it is better to go directly on the object level scenario analysis as above. We should not expect the improvement to be enormous.
Here I have used a square root diminishing return model. That drives some of the flatness of the optima: had I used a logarithm function things would have been even flatter, while if the returns diminish more mildly the gains of optimal effort allocation would have been more noticeable. Clearly, understanding the diminishing returns, number of alternatives, and cost of learning probabilities better matters for setting your strategy.
In the case of future studies we know the number of scenarios are very large. We know that the returns to forecasting efforts are strongly diminishing for most kinds of forecasts. We know that extra efforts in reducing uncertainty about scenario probabilities in e.g. climate models also have strongly diminishing returns. Together this suggests that Robin is right, and it is rational to stop clustering too hard on favorite scenarios. Insofar we learn something useful from considering scenarios we should explore as many as feasible.
What have we learned since 1957? Did we predict what it would be? And what does it tell us about our future?
Some notes for the panel discussion “‘We’ve never had it so good’ – how does the world today compare to 1957?” 11 May 2015 by Dr Anders Sandberg, James Martin Research Fellow at the Future of Humanity Institute, Oxford Martin School, Oxford University.
Taking the topic “how does the world today compare to 1957?” a bit literally and with a definite technological bent, I started reading old issues of Nature to see what people were thinking about back then.
Technology development
Space
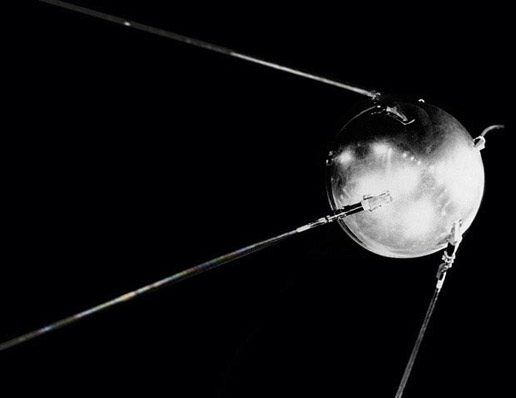
In 1957 the space age began.
Sputnik 1
Sputnik 1, the first artificial satellite, was launched on 4 October 1957. On November 3 Sputnik 2 was launched, with Laika, the first animal to orbit the Earth. The US didn’t quite manage to follow up within the year, but succeeded with Explorer 1 in January 1958.
Right now, Voyager 1 is 19 billion km from earth, leaving the solar system for interstellar space. Probes have visited all the major bodies of the solar system. There are several thousand satellites orbiting Earth and other bodies. Humans have set their footprint on the Moon – although the last astronaut on the moon left closer to 1957 than the present.
There is a pair of surprises here. The first is how fast humanity went from primitive rockets and satellites to actual moon landings – 12 years. The second is that the space age did not grow into a roaring colonization of the cosmos, despite the confident predictions of nearly anybody in the 1950s. In many ways space embodies the surprises of technological progress – it can go both faster and slower than expected, often at the same time.
Nuclear
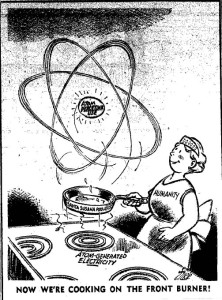
1957 also marks the first time that power was generated from a commercial nuclear plant, at Santa Susana, California, and the first full-scale nuclear power plant (Shippingport, Pennsylvania). Now LA housewives were cooking with their friend the atom! Ford announced their Nucleon atomic concept car 1958 – whatever the future held, it was sure to be nuclear powered!
Except that just like the Space Age the Atomic Age turned out to be a bit less pervasive than imagined in 1957.
One reason might be found in the UK Windscale nuclear power plant accident on 10th October 1957. Santa Susana also turned into an expensive superfund clean-up site. Making safe and easily decommissioned nuclear plants turned out to be far harder than imagined in the 1950s. Maybe, as Freeman Dyson has suggested[1], the world simply choose the wrong branch of the technology tree to walk down, selecting the big and complex plants suitable for nuclear weapons isotopes rather than small, simple and robust plants. In any case, today nuclear power is struggling both against cost and broadly negative public perceptions.
In April 1957 IBM sells the first compiler for the FORTRAN scientific programming language, as a hefty package of punched cards. This represents the first time software allowing a computer to write software is sold.
The term “artificial intelligence” had been invented the year before at the famous Dartmouth conference on artificial intelligence, which set out the research agenda to make machines that could mimic human problem solving. Newell, Shaw and Simon demonstrated the General Problem Solver (GPS) in 1957, a first piece of tangible progress.
While the Fortran compiler was a completely independent project it does represent the automation of programming. Today software development involves using modular libraries, automated development and testing: a single programmer can today do projects far outside what would have been possible in the 1950s. Cars run software on the order of 100s of million lines of code, and modern operating systems easily run into the high tens of millions of lines of code[2].
Moore’s law, fitted with Jacknifed sigmoids. Green lines mark 98% confidence interval. Data from Nordhaus.
In 1957 Moore’s law was not yet coined as a term, but the dynamics was already ongoing: computer operations per second per dollar was increasing exponentially (this is the important form of Moore’s law, rather than transistor density – few outside the semiconductor industry actually care about that). Today we can get about 440 billion times as many computations per second per dollar now as in 1957. Similar laws apply to storage (in 1956 IBM shipped the first hard drive in the RAMAC 305 system. The drive held 5MB of data at $10,000 a megabyte, as big as two refrigerators), memory prices, sizes of systems and sensors.
This tremendous growth have not only made complex and large programs possible, or enabled supercomputing (today’s best supercomputer is about 67 billion times more powerful than the first ones in 1964), but has also allowed smaller and cheaper devices that can be portable and used everywhere. The performance improvement can be traded for price and size.
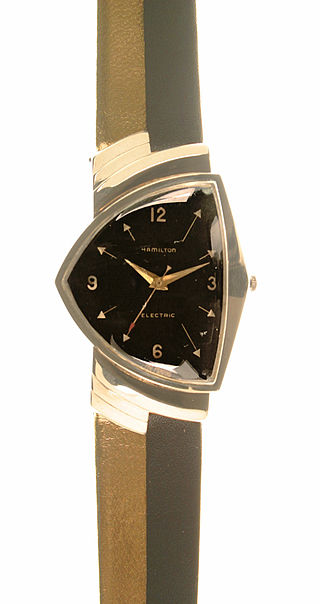
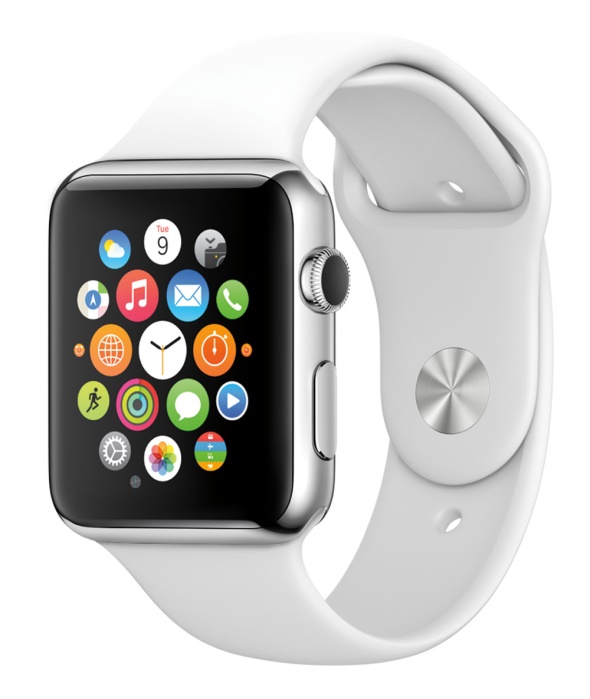
In 1957 the first electric watch – the Hamilton Ventura – was sold. Today we have the Apple watch. Both have the same main function, to show off the wealth of their owner (and incidentally tell time), but the modern watch is also a powerful computer able to act as a portal into our shared information world. Embedded processors are everywhere, from washing machines to streetlights to pacemakers.
Why did the computers take off? Obviously there was a great demand for computing, but the technology also contained the seeds of making itself more powerful, more flexible, cheaper and useful in ever larger domains. As Gordon Bell noted in 1970, “Roughly every decade a new, lower priced computer class forms based on a new programming platform, network, and interface resulting in new usage and the establishment of a new industry.”[3]
At the same time, artificial intelligence has had a wildly bumpy ride. From confident predictions of human level intelligence within a generation to the 1970s “AI winter” when nobody wanted to touch the overhyped and obsolete area, to the current massive investments in machine learning. The problem was to a large extent that we could not tell how hard problems in the field were: some like algebra and certain games yielded with ease, others like computer vision turned out to be profoundly hard.
Biotechnology
In 1957 Francis Crick laid out the “central dogma of molecular biology”, which explained the relationship between DNA, RNA, and proteins (DNA is translated into RNA, which is translated into proteins, and information only flows this way). The DNA structure had been unveiled four years earlier and people were just starting to figure out how genetics truly worked.
(Incidentally, the reason for the term “dogma” was that Crick, a nonbeliever, thought the term meant something that was unsupported by evidence and just had to be taken by faith, rather than the real meaning of the term, something that has to be believed no matter what. Just like “black holes” and the “big bang”, names deliberately coined to mock, it stuck.)
It took time to learn how to use DNA, but in the 1960s we learned the language of the genetic code, by the early 1970s we learned how to write new information into DNA, by the 1980s commercial applications began, by the 1990s short genomes were sequenced…
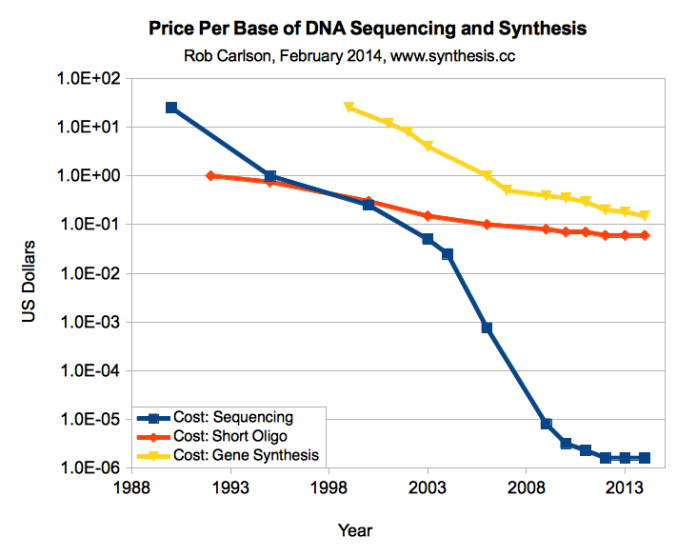
Today we have DNA synthesis machines that can be bought on eBay, unless you want to order your DNA sequence online and get a vial in the mail. Conversely, you can send off a saliva sample and get a map (or the entire sequence) of your genome back. The synthetic biology movement are sharing “biobricks”, modular genetic devices that can be combined and used to program cells. Students have competitions in genetic design.
The dramatic fall in price of DNA sequencing and synthesis mimics Moore’s law and is in some sense a result of it: better computation and microtechnology enables better biotechnology. Conversely, the cheaper it is, the more uses can be found – from marking burglars with DNA spray to identifying the true origins of sushi. This also speeds up research, leading to discoveries of new useulf tricks, for example leading to the current era of CRISPR/Cas genetic editing which promises vastly improved precision and efficiency over previous methods.
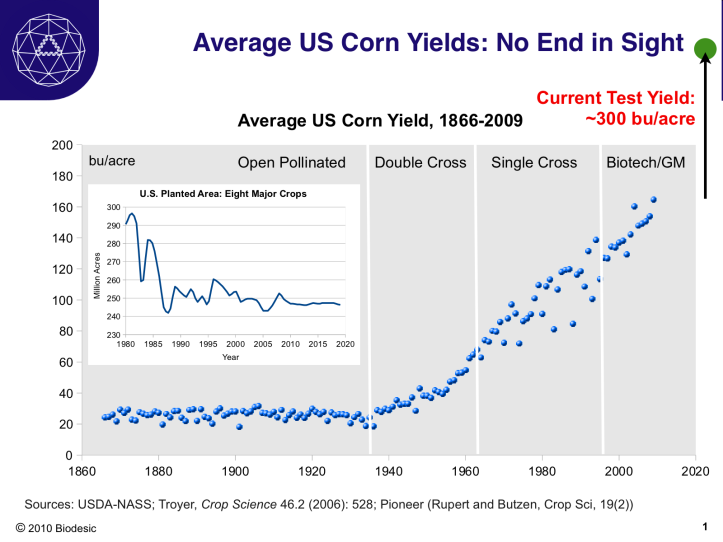
Biotechnology is of course more than genetics. One of the most important aspects of making the world better is food security. The gains in agricultural productivity have also been amazing. One of the important take-home messages in the above graph is that the improvement began before we started to explicitly tinker with the genes: crossing methods in the post-war era already were improving yields. Also, the Green Revolution in the 1960s was driven not just by better varieties, but by changes in land use, irrigation, fertilization and other less glamorous – but important – factors. The utility of biotechnology in the large is strongly linked to how it fits with the infrastructure of society.
Learning about what is easy and hard requires experience. Space was on one hand easy – it only took 17 years from Sputnik before the astronauts left the moon – but making it sustained turned out to be hard. Nuclear power was easy to make, but hard to make safe enough to be cheap and acceptable. Software has taken off tremendously, but compilers have not turned into “do what I mean” – yet routine computer engineering is regularly producing feats beyond belief that have transformed our world. AI has died the hype death several times, yet automated translation, driving, games, logistics and information services are major business today. Biotechnology had a slow ramp-up, then erupted and now schoolchildren modifying genes – yet heavy resistance holds it back, largely not because of any objective danger but because of cultural views.
If we are so bad at predicting what future technology will transform the world, what are we to do when we are searching for the Next Big Thing to solve our crises? The best approach is to experiment widely. Technologies with low thresholds of entry – such as software and now biotechnology – allow for more creative exploration. More people, more approaches and more aims can be brought to bear, and will find unexpected use for them.
The main way technologies become cheap and ubiquitous is that they are mass produced. As long as spacecraft and nuclear reactors nearly one-offs they will remain expensive. But as T. P. Wright observed, the learning curve makes each new order a bit cheaper or better. If we can reach the point where many are churned out they will not just be cheap, they will also be used for new things. This is the secret of the transistor and electronic circuit: by becoming so cheap they could be integrated anywhere they also found uses everywhere.
So the most world-transforming technologies are likely to be those that can be mass-produced, even if they from the start look awfully specialized. CCDs were once tools for astronomy, and now are in every camera and phone. Cellphones went from a moveable telephone to a platform for interfacing with the noosphere. Expect the same from gene sequencing, cubesats and machine learning. But predicting what technologies will dominate the world in 60 years’ time will not be possible.
Are we better off?
Having more technology, being able to reach higher temperatures, lower pressures, faster computations or finer resolutions, does not equate to being better off as humans.
Healthy and wise
Life expectancy (male and female) in England and Wales.
Perhaps the most obvious improvement has been health and life expectancy. Our “physiological capital” has been improving significantly. Life expectancy at birth has increased from about 70 in 1957 to 80 at a steady pace. The chance of living until 100 went up from 12.2% in 1957 to 29.9% in 2011[4].
The most important thing here is that better hygiene, antibiotics, and vaccinations happened before 1957! They were certainly getting better afterwards, but the biggest gains were likely early. Since 1957 it is likely that the main causes have been even better nutrition, hygiene, safety, early detection of many conditions, as well as reduction of risk factors like smoking.
Advanced biomedicine certainly has a role here, but it has been smaller than one might be led to think until about the 1970s. “Whether or not medical interventions have contributed more to declining mortality over the last 20 years than social change or lifestyle change is not so clear.”[5] This is in many ways good news: we may have a reserve of research waiting to really make an impact. After all, “evidence based medicine”, where careful experiment and statistics are applied to medical procedure, began properly in the 1970s!
A key factor is good health habits, underpinned by research, availability of information, and education level. These lead to preventative measures and avoiding risk factors. This is something that has been empowered by the radical improvements in information technology.
Consider the cost of accessing an encyclopaedia. In 1957 encyclopaedias were major purchases for middle class families, and if you didn’t have one you better have bus money to go to the local library to look up their copy. In the 1990s the traditional encyclopaedias were largely killed by low-cost CD ROMs… before Wikipedia appeared. Wikipedia is nearly free (you still need an internet connection) and vastly more extensive than any traditional encyclopaedia. But the Internet is vastly larger than Wikipedia as a repository of knowledge. The curious kid also has the same access to the ArXiv preprint server as any research physicist: they can reach the latest paper at the same time. Not to mention free educational courses, raw data, tutorials, and ways of networking with other interested people.
Wikipedia is also good demonstration of how the rules change when you get something cheap enough – having volunteers build and maintain something as sophisticated as an encyclopaedia requires a large and diverse community (it is often better to have many volunteers than a handful of experts, as competitors like Scholarpedia have discovered), and this would not be possible without easy access. It also illustrates that new things can be made in “alien” ways that cannot be predicted before they are tried.
Risk
But our risks may have grown too.
1957 also marks the launch of the first ICBM, a Soviet R-7. In many ways it is intrinsically linked to spaceflight: an ICBM is just a satellite with a ground-intersecting orbit. If you can make one, you can build the other.
By 1957 the nuclear warhead stockpiles were going up exponentially and had reached 10,000 warheads, each potentially able to destroy a city. Yields of thermonuclear weapons were growing larger, as imprecise targeting made it reasonable to destroy large areas in order to guarantee destruction of the target.
Nuclear warhead stockpiles. From the Center of Arms Control and Non-Proliferation.
While the stockpiles have decreased and the tensions are not as high as during the peak of the cold war in the early 80s, we have more nuclear powers, some of which are decidedly unstable. The intervening years have also shown a worrying number of close calls – not just the Cuban Missile crisis but many other under-reported crises, flare-ups and technical mishaps (Indeed, in May 22 1957 a 42,000-pound hydrogen bomb accidentally fell from a bomber near Albuquerque). The fact that we got out of the Cold War unscathed is surprising – or maybe not, since we would not be having this discussion if it had turned hot.
The biological risks are also with us. The Asian Bird Flu pandemic in 1957 claimed over 150,000 lives world-wide. Current gain-of-function research may, if we are very unlucky, lead to a man-made pandemic with a worse outcome. The paradox here is that this particular research is motivated by a desire to understand how bird flu can make the jump from birds to an infectious human pathogen: we need to understand this better, yet making new pathogens may be a risky path.
The SARS and Ebola crises show that we both have become better at handling a pandemic emergency, but also have far to go. It seems that the natural biological risk may have gone down a bit because of better healthcare (and increased a bit due to more global travel), but the real risks from misuse of synthetic biology are not here yet. While biowarfare and bioterrorism are rare, they can have potentially unbounded effects – and cheaper, more widely available technology means it may be harder to control what groups can attempt it.
1957 also marks the year when Africanized bees escaped in Brazil, becoming one of the most successful and troublesome invasive (sub)species. Biological risks can be directed to agriculture or the ecosystem too. Again, the intervening 60 years have shown a remarkably mixed story: on one hand significant losses of habitat, the spread of many invasive species, and the development of anti-agricultural bioweapons. On the other hand a significant growth of our understanding of ecology, biosafety, food security, methods of managing ecosystems and environmental awareness. Which trend will win out remains uncertain.
The good news is that risk is not a one-way street. We likely have reduced the risk of nuclear war since the heights of the Cold War. We have better methods of responding to pandemics today than in 1957. We are aware of risks in a way that seems more actionable than in the past: risk is something that is on the agenda (sometimes excessively so).
Coordination
1957/1958 was the International Geophysical Year. The Geophysical Year saw the US and Soviet Union – still fierce rivals – cooperate on understanding and monitoring the global system, an ever more vital part of our civilization.
1957 was also the year of the treaty of Rome, one of the founding treaties of what would become the EU. For all its faults the European Union demonstrates that it is possible through trade to stabilize a region that had been embroiled in wars for centuries.
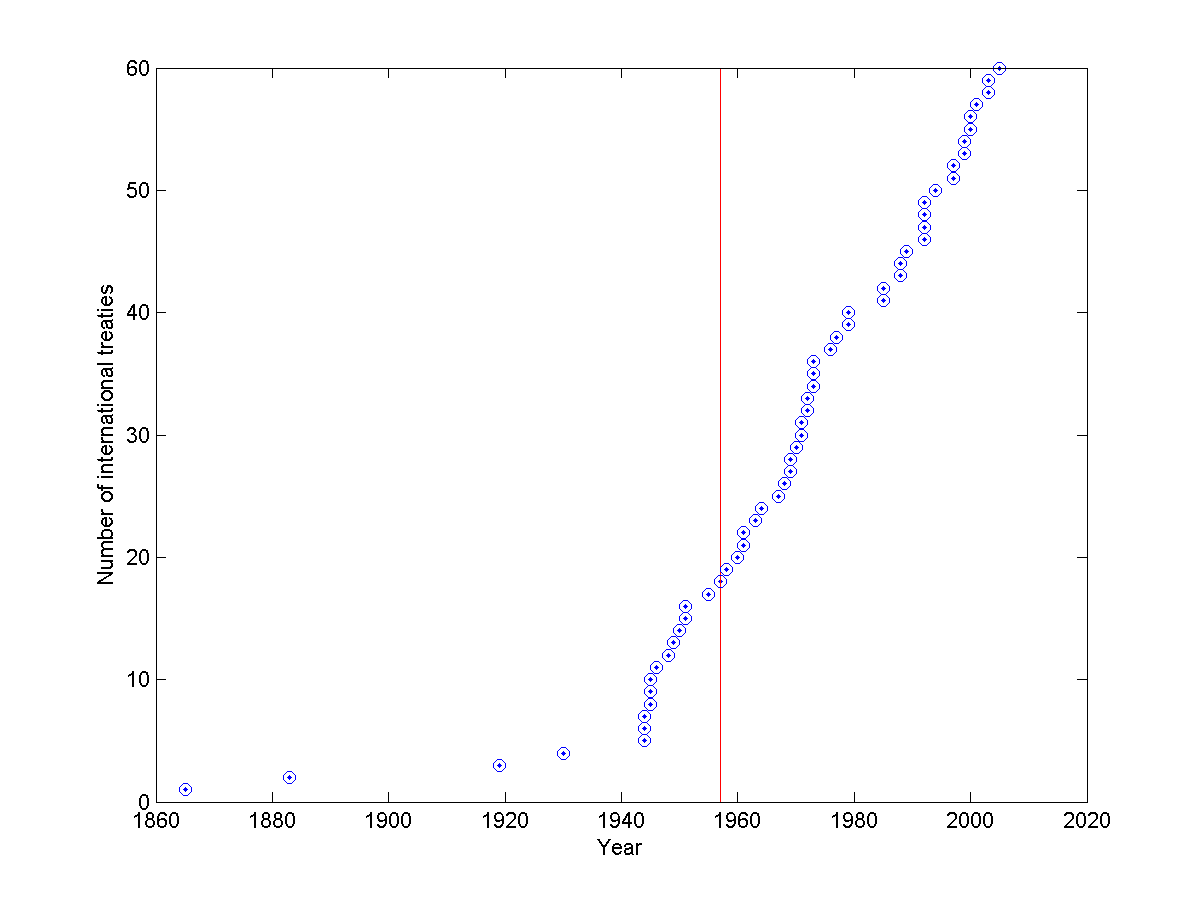
Number of international treaties over time. Data from Wikipedia.
The number of international treaties has grown from 18 in 1957 to 60 today. While not all represent sterling examples of cooperation they are a sign that the world is getting somewhat more coordinated.
Globalisation means that we actually care about what goes on in far corners of the world, and we will often hear about it quickly. It took days after the Chernobyl disaster in 1986 before it was confirmed – in 2011 I watched the Fukushima YouTube clip 25 minutes after the accident, alerted by Twitter. It has become harder to hide a problem, and easier to request help (overcoming one’s pride to do it, though, remains as hard as ever).
The world on 1957 was closed in many ways: two sides of the Cold War, most countries with closed borders, news traveling through narrow broadcasting channels and transport/travel hard and expensive. Today the world is vastly more open, both to individuals and to governments. This has been enabled by better coordination. Ironically, it also creates more joint problems requiring joint solutions – and the rest of the world will be watching the proceedings, noting lack of cooperation.
Final thoughts
The real challenges for our technological future are complexity and risk.
We have in many ways plucked the low-hanging fruits of simple, high-performance technologies that vastly extend our reach in energy, material wealth, speed and so on, but run into subtler limits due to the complexity of the vast technological systems we need. The problem of writing software today is not memory or processing speed but handling a myriad of contingencies in distributed systems subject to deliberate attacks, emergence, localization, and technological obsolescence. Biotechnology can do wonders, yet has to contend with organic systems that have not been designed for upgradeability and spontaneously adapt to our interventions. Handling complex systems is going to be the great challenge for this century, requiring multidisciplinary research and innovations – and quite likely some new insights on the same level as the earth-shattering physical insights of the 20th century.
More powerful technology is also more risky, since it can have greater consequences. The reach of the causal chains that can be triggered with a key press today are enormously longer than in 1957. Paradoxically, the technologies that threaten us also have the potential to help us reduce risk. Spaceflight makes ICBMs possible, but allows global monitoring and opens the possibility of becoming a multi-planetary species. Biotechnology allows for bioweapons, but also disease surveillance and rapid responses. Gene drives can control invasive species and disease vectors, or sabotage ecosystems. Surveillance can threaten privacy and political freedom, yet allow us to detect and respond to collective threats. Artificial intelligence can empower us, or produce autonomous technological systems that we have no control over. Handling risk requires both having an adequate understanding of what matters, designing the technologies, institutions or incentives that can reduce the risk – and convincing the world to use them.
The future of our species depends on what combination of technology, insight and coordination ability we have. Merely having one or two of them is not enough: without technology we are impotent, without insight we are likely to go in the wrong direction, and without coordination we will pull apart.
Fortunately, since 1957 I think we have not just improved our technological abilities, but we have shown a growth of insight and coordination ability. Today we are aware of global environmental and systemic problems to a new degree. We have integrated our world to an unprecedented degree, whether through international treaties, unions like the EU, or social media. We are by no means “there” yet, but we have been moving in the right direction. Hence I think we never had it so good.
[1]Freeman Dyson, Imagined Worlds. Harvard University Press (1997) P. 34-37, p. 183-185


Q_i)^\alpha")


=\sqrt{\gamma/N}/C")

=\sqrt{2\gamma/NC^2}")