If you are into civilization-scale prepping, this paper is a must read: Jehn, Florian Ulrich, Maximilian Rössler, Luke Kemp, Mike Cassidy, Zachary Kallenborn, Juan Bartolomé García Martínez, Lara Mani, and Matt Boyd. “No place to hide? Regional resilience and vulnerability to global catastrophic risk.” Global Challenges. 10:8 (2026).
The key point is that there is no best place to be in a global disaster: some are better in some circumstances, but none are good against all GCRs.
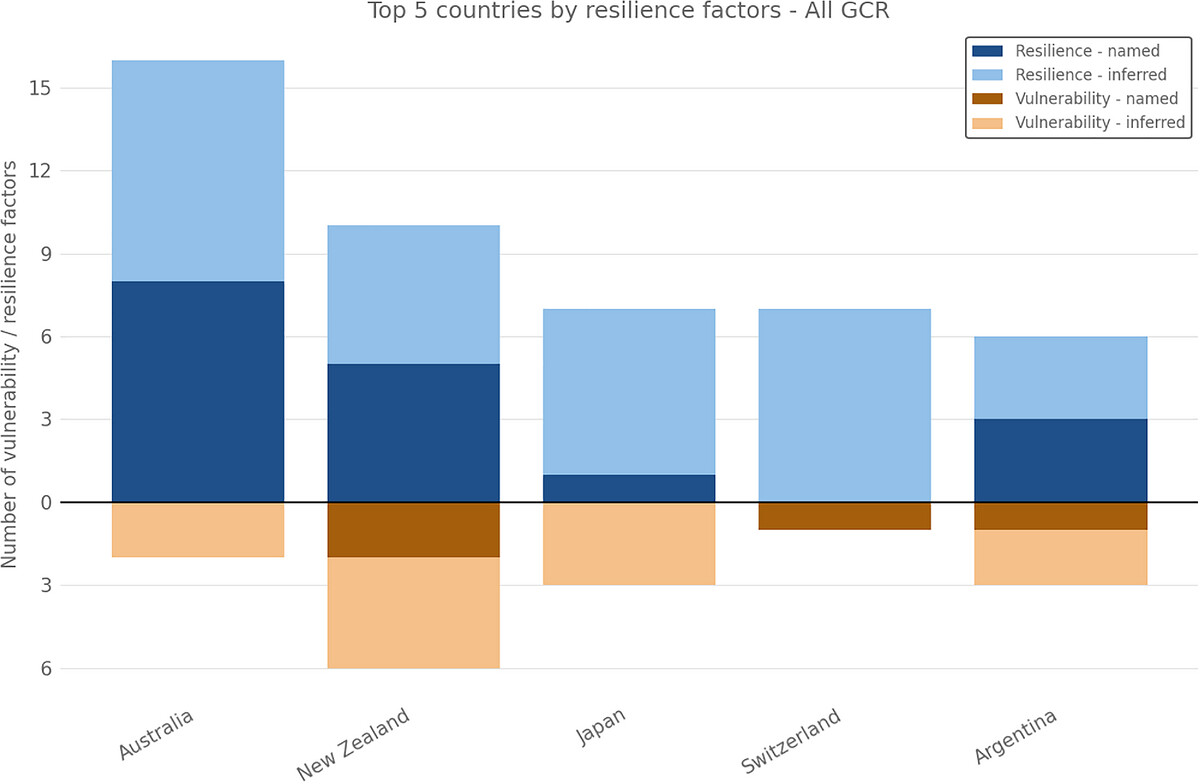
Fig 8 from the paper: Overview of how often countries were mentioned directly as resilient or vulnerable in cited documents or inferred by the authors of this paper based on factors described in other documents.
Factors that add resilience against some things (e.g. being an island) are at odds with other factors (e.g. volcanism, weak access to global supply chains). Geography is hard to change. Hi-tech societies have resources, but are vulnerable to cyberattacks and HEMP.
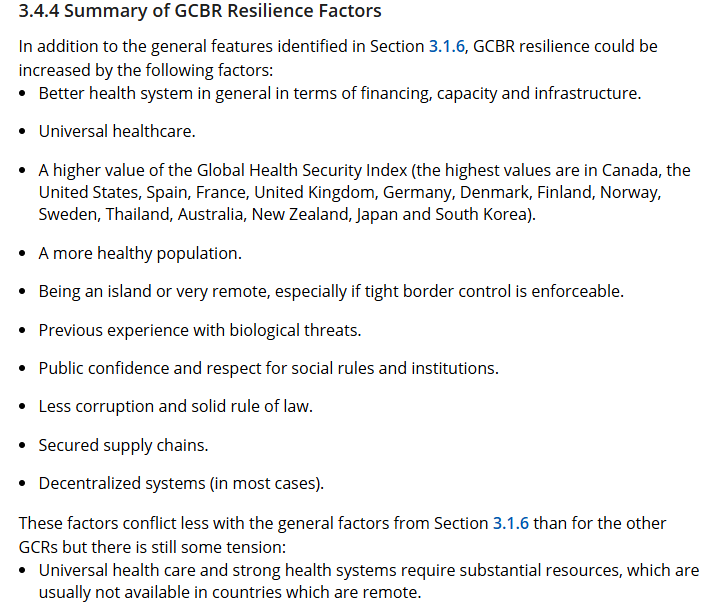
There are however synergistic factors that can be improved: governance quality (democratic institutions, low inequality, state capacity, low corruption, and social cohesion are protective), decentralization, preparedness, food system resilience.
(Yes, one can totally imagine an enlightened authoritarian doing great here by harnessing state capacity… except that there are not many Lee Kuan Yews around – try to find examples beside Singapore that reliably has pulled it off. The base rate is low, so one cannot rely on this in a crisis. Democracies are the reliable low variance approach.)
The caricature prepper planning to outlast the End alone with toilet paper and guns was of course wrong, since disaster survival is very much a community thing. The same applies to GCRs: there is no place that can smugly ignore the rest of the world, we need the global community.
Interactive Interface
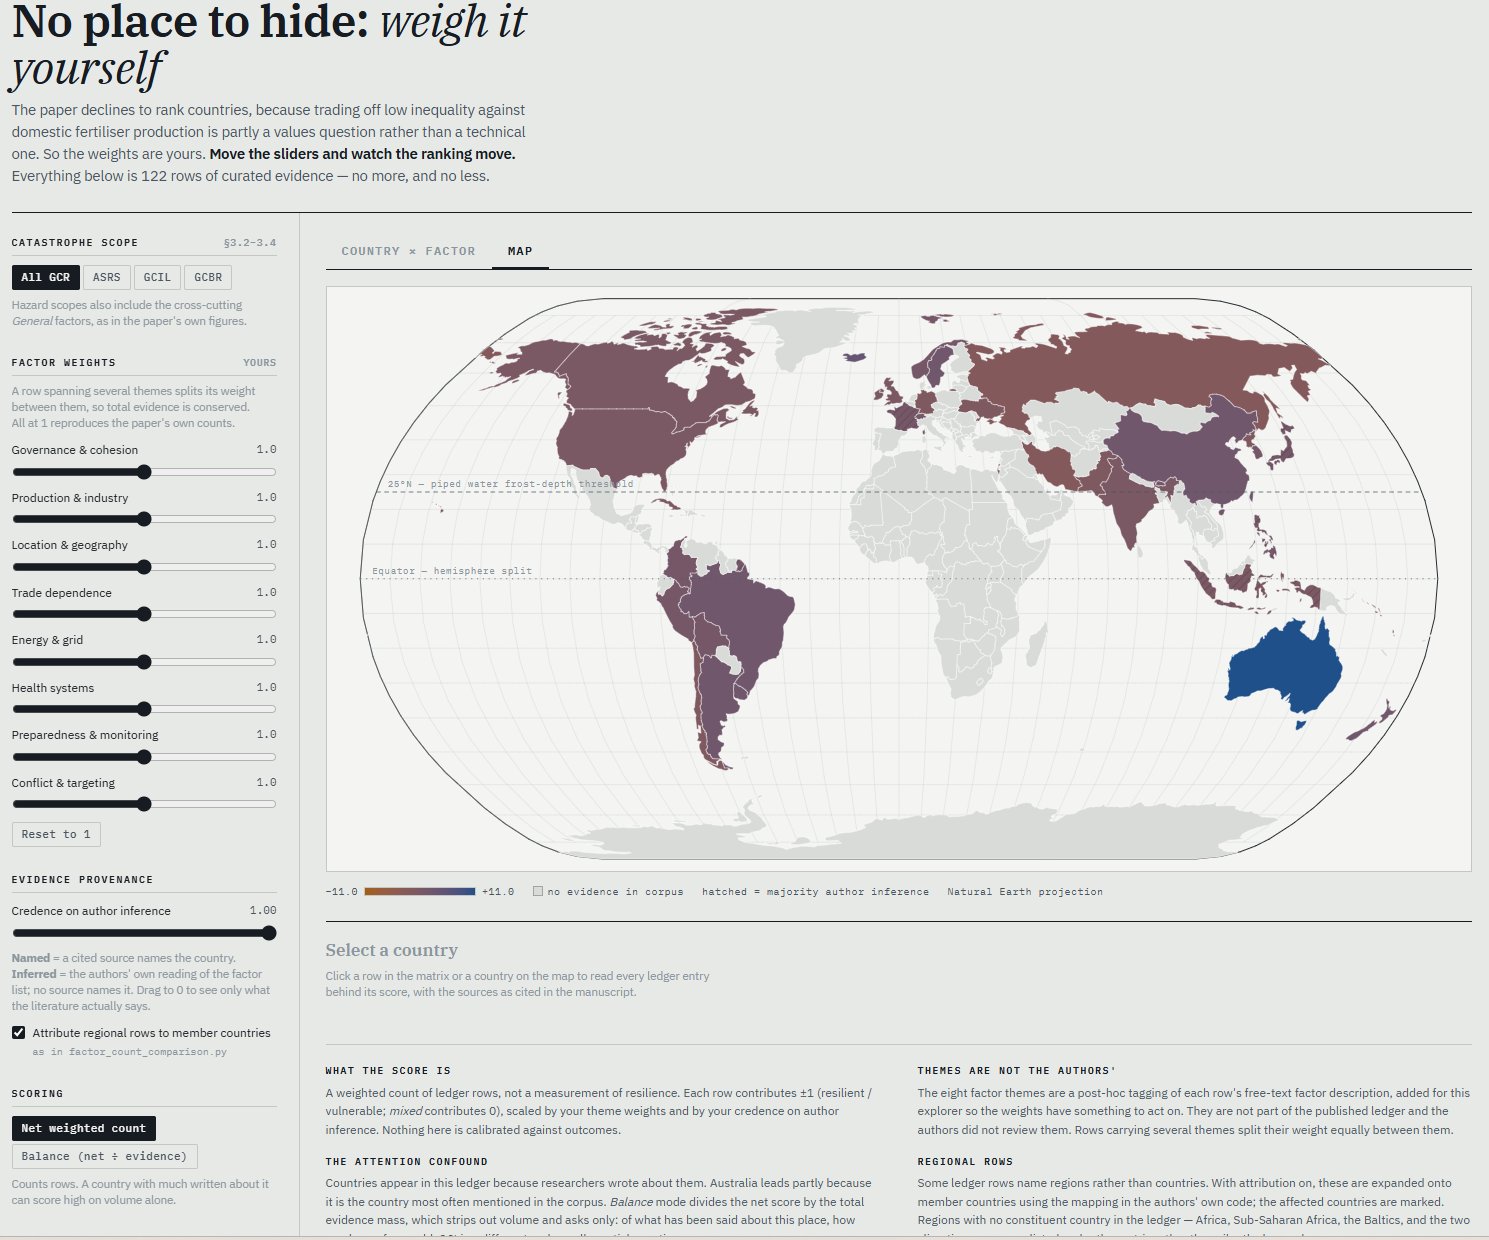
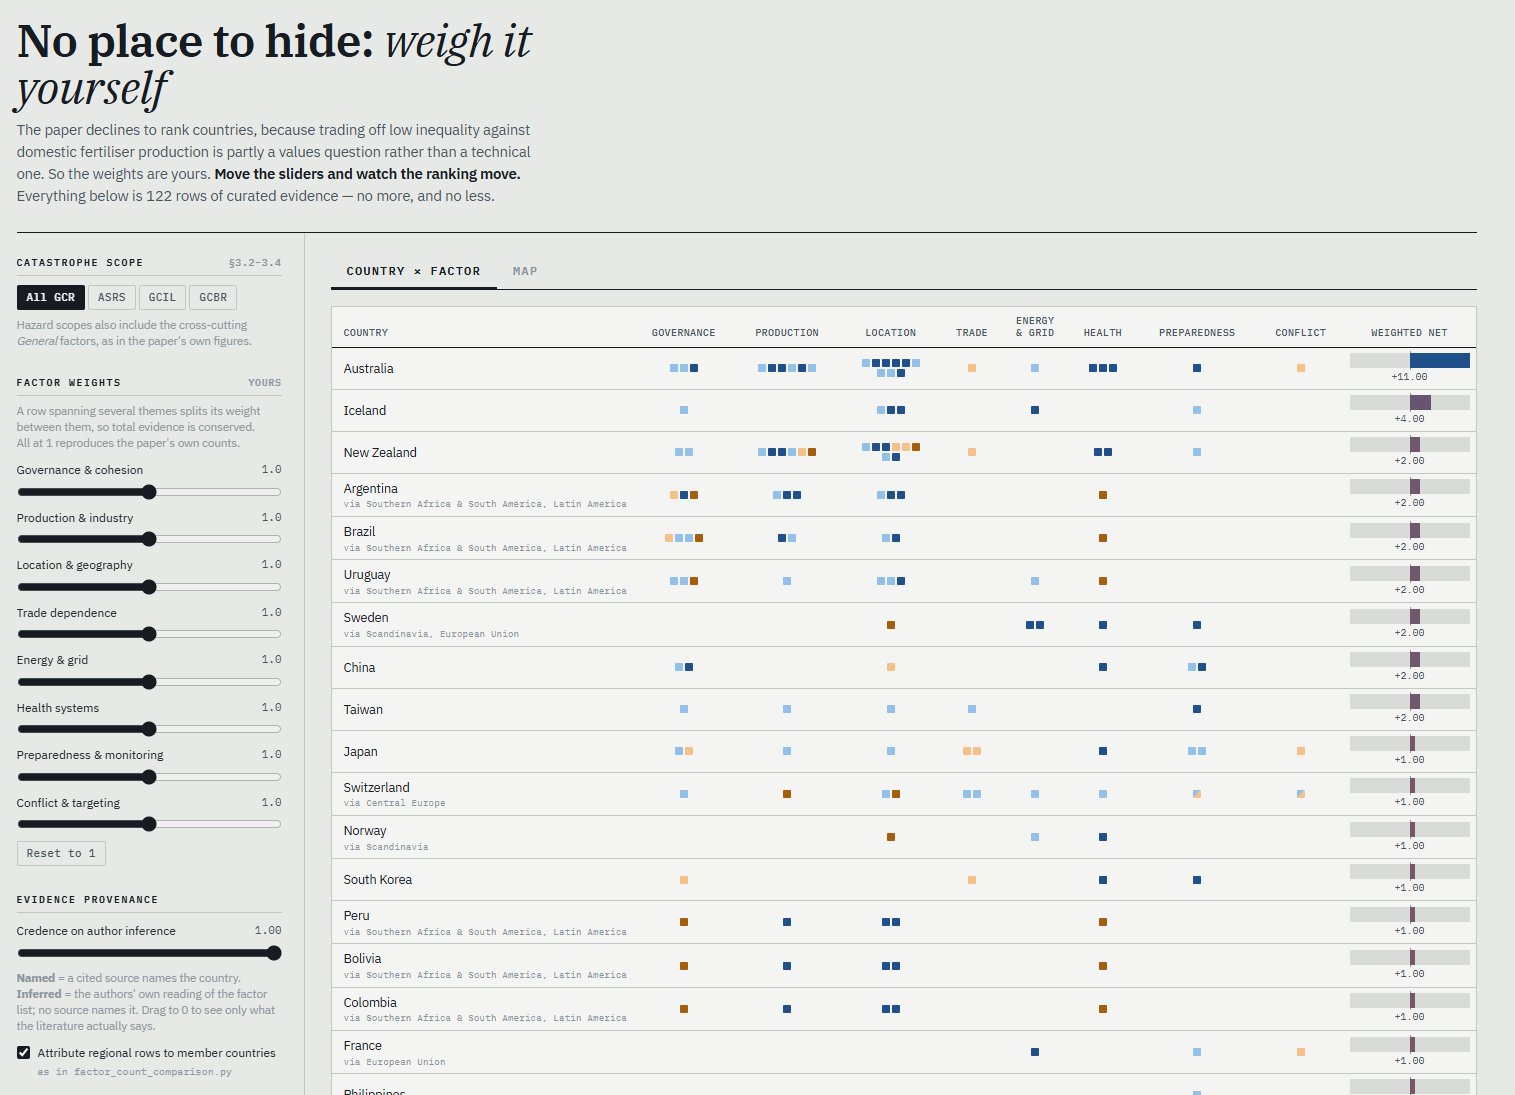
I really liked the paper, but I was curious about the data. So I quickly vibe-coded an interactive interface.
You can find it at https://aleph.se/references/gcr-resilience-explorer.html – this is the Claude one-shot at interpreting the paper and supplementary data (the eight factors are his too). Very useful for getting a feel for what is in there.
You can change the weightings of the factors to change the ranking. The inference credence is how much you buy the author estimates vs the literature estimates. Net weighted count scoring tends to overweigh much-written-about countries like AUS; balanced divides by # of evidence, letting countries like Iceland shine.
I think what I first noticed is how scarce data is! This is not built on massive data. This is built on scattered reports painstakingly collected. There ought to be much, much more – an obvious follow up project would be to scour the open literature for more.
This is why the regional imputation is doing a lot of work. Which makes sense, since many disasters have a geographical nature and hence regions are hit somewhat similarly.
At least in my visualization it looks like Taiwan has no conflict risk, but that is because the marker just indicates nuclear war issues: makes sense in this context, but easy to misinterpret.
Still, I think the paper findings are solid and a bit obvious (in retrospect). What I really think one could do is to use AI to not just build a deeper database, perform clever imputation of missing data, but start mapping the cross-country links and correlations.
Automating the data-gathering may also allow what the paper points out: the situation is dynamic, and one should see it as a snapshot. Indeed, being able to disregard stale reports or extrapolate trends a bit might be valuable.
This is also a bit of a demonstration of a new way of reading papers: do not just ask for an AI summary, ask for an interactive exploration!