I recently nerded out about high-energy proton interaction with matter, enjoying reading up on the Bethe equation at the Particle Data Group review and elsewhere. That got me to look around at the PDL website, which is full of awesome stuff – everything from math and physics reviews to data for the most obscure “particles” ever, plus tests of how conserved the conservation laws are.
That binge led me to this interesting set of historical graphs of the estimates of various physical constants in the PDG publications over time:
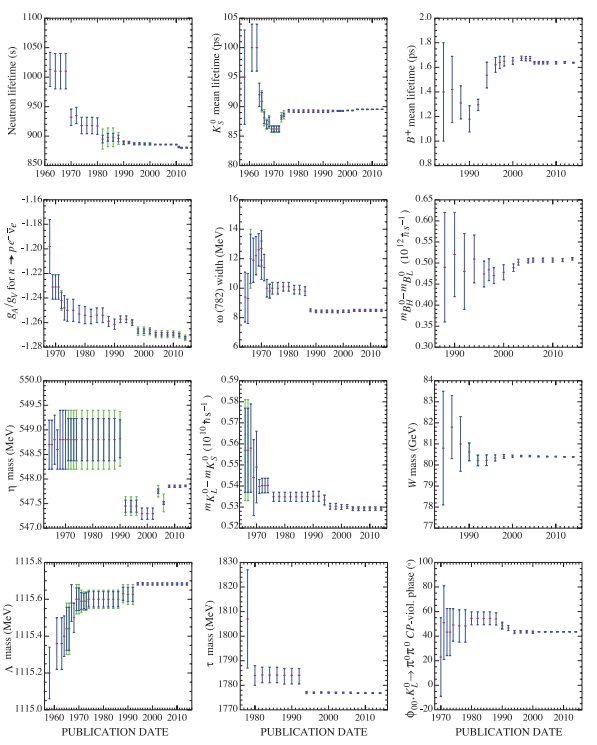
The first thing that strikes the viewer is that they have moved a fair bit, including often being far outside the original error bars. 6 of them have escaped them. That doesn’t look very good for science!
Fortunately, it turns out that these error bars are not 95% confidence intervals (the most common form in many branches of science) but 68.3% confidence intervals (one standard deviation, if things are normal). That means having half of them out of range is entirely reasonable! On the other hand, most researchers don’t understand error bars (original paper), and we should be able to do much better.
The PDG state:
Sometimes large changes occur. These usually reflect the introduction of significant new data or the discarding of older data. Older data are discarded in favor of newer data when it is felt that the newer data have smaller systematic errors, or have more checks on systematic errors, or have made corrections unknown at the time of the older experiments, or simply have much smaller errors. Sometimes, the scale factor becomes large near the time at which a large jump takes place, reflecting the uncertainty introduced by the new and inconsistent data. By and large, however, a full scan of our history plots shows a dull progression toward greater precision at central values quite consistent with the first data points shown.
Overall, kudos to PDG for showing the history and making it clearer what is going on! But I do not agree it is a dull progression.
Zigzag to truth
The locus classicus for histories of physical constants being not quite a monotonic march towards truth is Max Henrion and Baruch Fischhoff. Assessing uncertainty in physical constants. American Journal of Physics 54, 791 (1986); doi: 10.1119/1.14447. They discuss the problem of people being overconfident and badly calibrated, and then show the zigzagging approach to current values:
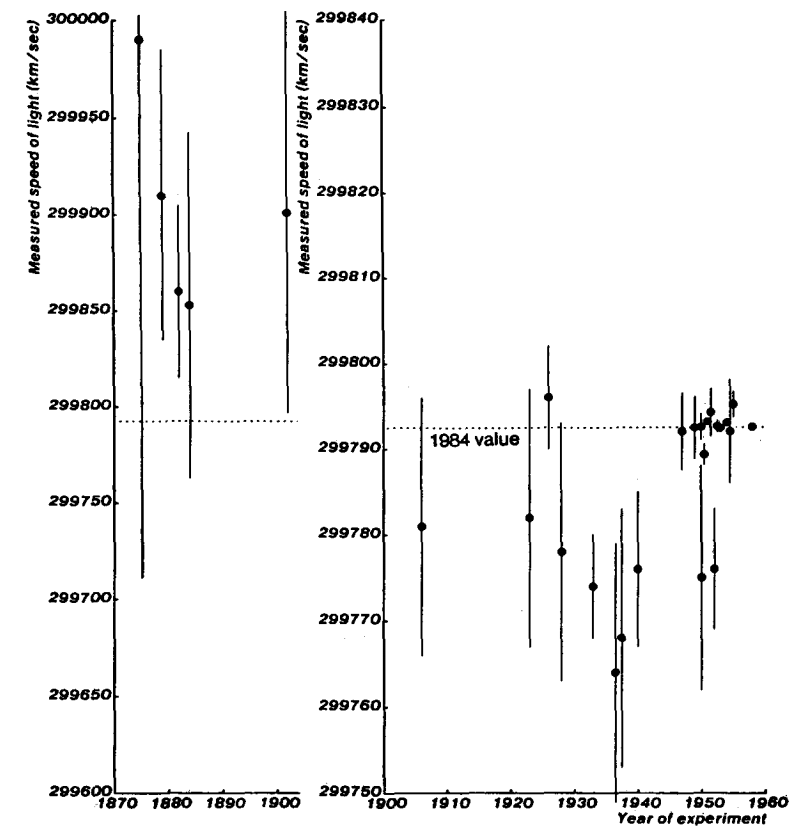
Note that the shifts were far larger than the estimated error bars. The dip in the 1930s and 40s even made some physicists propose that c could be changing over time. Overall Henrion and Fischhoff find that physicists have been rather overconfident in their tight error bounds on their measurements. The approach towards current estimates is anything but dull, and hides many amusing historical anecdotes.
Stories like this might have been helpful; it is notable that the PDG histories on the right, for newer constants, seem to stay closer to the present value than the longer ones to the left. Maybe this is just because they have not had the time to veer off yet, but one can be hopeful.
Still, even if people are improving this might not mean the conclusions stay stable or approach truth monotonically. A related issue is “negative learning”, where more data and improved models make the consensus view of a topic move in the wrong direction: Oppenheimer, M., O’Neill, B. C., & Webster, M. (2008). Negative learning. Climatic Change, 89(1-2), 155-172. Here the problem is not just that people are overconfident in how certain they can be about their conclusions, but also that there is a bit of group-think, plus that the models change in structure and are affected in different ways by the same data. They point out how estimates of ozone depletion oscillated, or the consensus on the stability of climate has shifted from oscillatory (before 1968) towards instability (68-82), towards stability (82-96), and now towards instability again (96-06). These problems are not due to mere irrationality, but the fact that as we learn more and build better models these incomplete but better models may still deviate strongly from the ground truth because they miss some key component.
Noli fumare
This is related to what Nick Bostrom calls the “data fumes” problem. Early data will be fragmentary and explanations uncertain – but the data points and their patterns are very salient, just as the early models, since there is nothing else. So we begin to anchor on them. Then new data arrives and the models improve… and the old patterns are revealed as statistical noise, or bugs in the simulation or plotting routine. But since we anchored on them, we are unlikely to update as strongly towards the new most likely estimates. Worse, accommodating a new model takes mental work; our status quo bias will be pushing against the update. Even if we do accommodate the new state, things will likely change more – we may well end up either with a view anchored on early noise, or assume that the final state is far more uncertain than it actually is (since we weigh the early jumps strongly because of their saliency).
This is of course why most people prefer to believe a charismatic diet cultleader expert rather than trying to dig through 70 years of messy, conflicting dietary epidemiology.
Here is a simple example where an agent is trying to do a maximum likelihood estimation of a Gaussian distribution with mean 1 and variance 1, but is hamstrung by giving double weight to the first 9 data points:
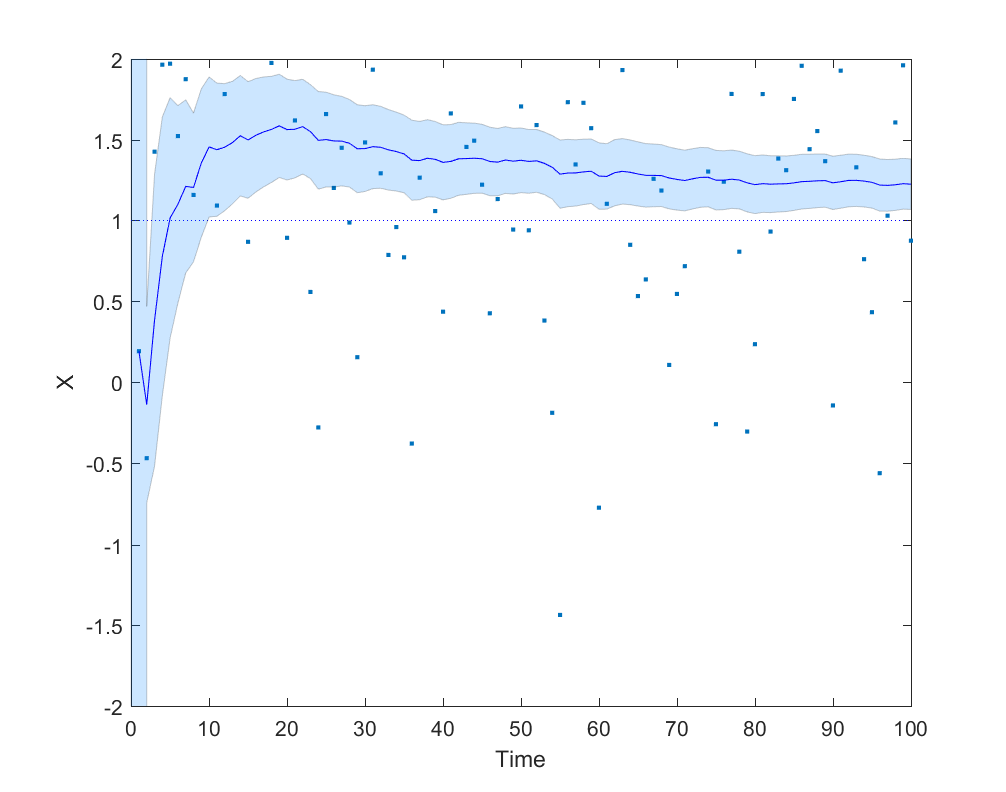
It is not hard to complicate the model with anchoring/recency/status quo bias (estimates get biased towards previous estimates), or that early data points are more polluted by differently distributed noise. Asymmetric error checking (you will look for bugs if results deviate from expectation and hence often find such bugs, but not look for bugs making your results closer to expectation) is another obvious factor for how data fumes can get integrated in models.
The problem with data fumes is that it is not easy to tell when you have stabilized enough to start trusting the data. It is even messier when the inputs are results generated by your own models or code. I like to approach it by using multiple models to guesstimate model error: for example, one mathematical model on paper and one Monte Carlo simulation – if they don’t agree, then I should disregard either answer and keep on improving.
Even when everything seems to be fine there may be a big crucial consideration one has missed. The Turing-Good estimator gives another way of estimating the risk of that: if you have acquired 


/N \ll 1")
Lack of capacity (on almost all fronts) for systems thinking surely plays a part in this, compounded by the fact of almost complete reliance upon reductionist methods by most scientists.
The combination of these two makes applying any Bayesian thinking to help with novel situations rather hard.
I often get to the point in conversations with scientists (I’m not one, despite a science education) where I say something along these lines and see a flicker in their eyes as the fear comes over them that they’ve been tricked into a conversation with a mystic who has read enough science to initially ‘pass’. Honestly, I don’t think I am such (but then I wouldn’t would I?).
But I am seriously concerned that our best scientific methodological tools are positively ancient. I’m not a historian of science, but isolating a single variable and keeping everything else equal must be C17th, and the acceptance of a statistical view of large numbers of instances assumed to be subject to the same (reductively constrained) conditions was last controversial in the late C19th. I am unaware of anything significant – ie not a refinement (like better mathematical tools, or Popper’s codifications), or a change in scope (like the application of fast computers) – that could be considered as a new fundamental methodological approach beyond these.
This seems poor going, both in terms of our own self-regard as a scientifically progressive species, but more seriously in terms of the nature of the issues we are now forced to confront for existential reasons.
Don’t get me wrong – I’m not knocking these methods. They have been stunningly effective. It’s just that I can’t come up with a convincing case for them being sufficient to help us address fundamentally complex problems like climate change (and the human brain – arguable the third most complex coherent system we are aware of).
The critically important work of syncretising mechanisms discovered in isolation from each other to arrive at better models of complex systems seems to rely entirely on clever people sitting at their desks with their eyes screwed shut/having long walks/revelatory dreams/random conversations with people from other disciplines.
Without knocking any of these things (I have read Paul Feyerabend a little), they seem a little happenstance – dare I say it, a little like alchemy?
It’s time for some serious work on well-founded techniques for integrating aspects of complex systems (I’m not talking about network analysis/visualisation tools either – these are descriptive/investigational, not syncretising). I’m sure that there are smart people, somewhere doing this – but they aren’t getting any attention at a level which would impinge on me (a regular New Scientist reader).
Obviously, something along the lines of this work is going on inside Deep Mind, but to use a quote from physicist Eugene Wigner that you will be beyond bored with, “It is nice to know that the computer understands the problem. But I would like to understand, too.”
(btw – I am the chap who buttonholed you at the end of your Guardian talk earlier this week – I valued our chat)
The problem with holism seems to be relatively few good success stories. We can all yearn for better understanding, but I can’t point to many unequivocal cases where systems thinking works and has predictive power except for when we apply dynamical systems theory, and then the toolkit is pretty similar to the usual one in science.
I can well imagine that an obvious problem with reductivism in the C14th was that it had yielded relatively few success stories!
However, I take the point. Holistic approaches (thank you for making it safe for me to use the word!), in order to address complex systems, are necessarily inherently complex. Developing reliable, usable, repeatable tools will not be straightforward or fast.
The principle of reductivism can be explained to a sensible person in a couple of spoken sentences. The statistical ideas behind aggregate behaviour or epidemiological approaches probably need longer to explain, almost certainly requiring visual aids – and the mathematical underpinnings needed to use the tools are complex and subtle.
Even once developed, tools to address complexity will likely require significant study, and require deep understanding to establish which tools are relevant, and how, in any given setting.
A hypothetical curve of complexity relating these tools is intuitively exponential, but the rewards for developing – or (perhaps more compellingly) the penalties for failing to develop such tools seem likely to follow a similar curve.
PS: This paper is perhaps groping in the direction I am suggesting :
https://www.ncbi.nlm.nih.gov/pmc/articles/PMC2553325/